Tile performance by compiler route
Saved comparisons and validation checkpoints through September 14, 2026. These are separate experiments, not a cross-route leaderboard with one matched timing and math policy. See current status for the conclusion and remaining goal.
Performance: preserve the measurement basis
Unless explicitly labeled otherwise, reported times are warm synchronized host-wall time per invocation, amortized over a batch. They include each runtime’s dispatch/encoding/submission and synchronization. They exclude JIT, setup allocations/uploads and cold-call setup; returned-output allocation stays inside timing where the recorded operator API requires it. They are not GPU hardware-event times, and CPU thread requests are not measurements of actual library worker use.
Report tables use medians of within-round p50s. A paired ratio is the median of same-round numerator/denominator ratios, not a ratio of the displayed medians. Ranges and counts of slower rounds are descriptive, not confidence intervals. No slow or failed row is discarded to improve the headline.
Top-K and sort now have multi-output cross-route coverage
The September 13 ranking checkpoint
adds shared finite-FP32 values/int64 indices tests and a five-route benchmark:
XIR/SIMD, XIR/Metal4, TIRx/Metal, eager Torch CPU and Torch MPS. The first
screen completes 60/60 OK across six R/N/K combinations, both directions,
through width 1025. Full values, tie/index rules, input immutability and
allocation guards are checked; a separate read-only NumPy oracle rechecks
all 65 retained output pairs including the smoke run.
These are still quadratic reference algorithms, not optimized selection or sorting. For descending Top-K at 128×257/K16, SIMD E2E is 6341.646 µs versus 111.688 µs for Torch CPU. The large gap motivates better library algorithms in addition to mapping. Each route has only one visit/order, three samples and substantial desktop coactivity: the screen is not a balanced performance ranking or cost calibration. E2E, instrumented GPU intervals and no-counter command-buffer controls are retained separately; no pure CPU kernel time is claimed. The initial SIMD unit suite also retains a 300-second LLVM compile timeout; it is not converted into a numerical pass by the successful screen.
The follow-up structured-map budget checkpoint
records a shared representation repair: SIMD ranking now passes in
22.69/25.87 seconds including JIT. This is not a kernel speedup. Metal4
retains a 300-second timeout followed by a complete 473-assertion rerun;
even tiny cases show seconds-scale completion jitter. Eighteen of twenty
host test cases pass independently; two existing SSA-budget rejection tests
still abort rather than returning an error. The complete host suite is not
green, and no repaired ranking performance table is claimed.
Attention priority: contribution mapping, with device failures retained
The September 14 Metal attention checkpoint
adds full-output attention validation to the Metal4 timing harness and retains
instrumented dispatch, feedback-only command-buffer and synchronized host times
separately. Sixteen fixed-batch BQ4/BQ1 visits show a small-shape dispatch-time
ratio of 0.415–0.434, but the larger prefill ratio spans 0.715–1.394. Group width
and private representation change with BQ; this is a whole-realization probe,
not a reduction-only speedup or a new default planner policy. The separate fresh
TIRx/MPS comparison is rejected for timing drift despite correct outputs.
The sampled XIR/Metal4 attention plans remain local_lanes=1: max/sum and
QK/PV contraction stay within each independent worker. The bridge has shuffle
lowering for its admitted one-dimensional distributed reductions, but not the
phase-specific ownership transitions needed by this complete attention program.
All four query-tile realizations also launch only one threadgroup: the current
total-work prior rewards fewer groups without modeling GPU residency/makespan.
TIRx already has cooperative reductions, so this is not a claim that all Metal
routes lack warp intrinsics. See the mapping review’s section 21 for the source
diagnosis and remaining implementation work; no measured MPS victory is claimed.
The subsequent fixed-BQ block-mapping experiment
completes 48 visits at fixed local1/math/representation, comparing automatic
grouping with block32. Prefill-q1 instrumented throughput ratios are
0.940–0.945, whereas small-q1 ratios are 1.040–1.044; prefill-q4 spans both
directions. RMSNorm’s throughput improves, but that case changes padding as
well as group packing. Wide-grid SwiGLU has no consistent instrumented win
and all four host-throughput pairs regress. The same-geometry control also
retains timing variation. No universal block32 policy or calibrated GPU
completion model is promoted; this experiment does not implement cooperative
attention reductions or establish a new cross-framework ranking.
The Chinese attention mapping review
separates existing cooperative/collective lowering, unmeasured matrix-initializer
work, and the remaining phase-specific output/contribution distribution search.
The new benchmark-only PV reduction switch is independent of QK and keeps
MMA as the default. Four additional prefill/ragged-decode FP64 checks pass
through SIMD; this does not promote the decomposition to a production policy.
The September 13 attention execution checkpoint
attempted the existing QK-reduce/PV-MMA control at two long-KV shapes. It
retains two native timeouts and a driver-reported MPS command-buffer GPU hang.
Although the runner marked six records numerically valid, the whole timing
cohort is disqualified. GPU experiments stopped before the PV-reduce timing
arm; it is NotRun, not an inferred win or failure. Re-establish queue and
completion stability before a balanced performance comparison or cost fit.
The subsequent CPU-only native-entry attention experiment
captures all four QK/PV representations at two prefill/decode shapes (KV through
2053), and validates 72 ABBA replay visits. With QK held fixed, replacing PV
MMA by reduction costs 1.252–1.332× on prefill and 1.060–1.129× on
decode. These are single-thread actual ORC-entry times, excluding Runtime,
Python and caller allocations; they are not a new Torch/MPS comparison.
MMA remains the default. Twelve further small correctness configurations cover
triangular masks, batch/head sharing and tails with two patterns per shader.
The LLM runner now isolates Torch in a subprocess so native-library stderr is captured even if Python reports success. Known GPU failure diagnostics invalidate the entire cohort and leave subsequent GPU visits NotRun. This closes the observed reporting loophole; it does not establish device recovery.
The separate full-packet attention experiment
checks ten configurations and 120 balanced native-entry visits. With the DSL,
QK/PV MMA and W8/block32/local1 fixed, the existing opt-in constant-width clone
reduces paired time by 24%–72% in five effective cases, including batch/MQA,
mixed tails and KV=8193. The other five no-clone/tail-only controls are retained.
This is backend-codegen evidence, not an automatic planner result or a fresh
Torch/MPS comparison. The unchanged abstract work prior misses full/tail masks
and code-size admission; production defaults remain unchanged.
The follow-up generic MMA output-block experiment
implements opt-in contiguous-output register blocks in the shared XIR bridge,
preserving each output’s K order and snapshot storage. Ninety-six native visits
show about 4.7% gain for R2 on unspecialized decode, but almost no extra gain
after full-packet specialization. R4 exceeds the clone budget and regresses
the requested-specialized decode by about 54%. All rows are retained. Four
relevant CTests pass, including strict bitwise accumulation and alias/snapshot
checks; this is not automatic cost calibration or measured Metal4 performance.
The separate MMA contraction-unroll experiment
keeps the global Tile/storage threshold fixed and adds an opt-in MMA-only cap.
Across 72 native-entry visits, cap8 restores the R4 decode full-packet clone
and reduces time by about 36%, but MHA D64 becomes about 4.8× slower and
prefill about 43% slower. The comparison is against the same requested
R4/R1 baseline, not Torch/MPS or the previously faster R1 decode. Dynamic
indexing of small SSA operands and output-loop replication are visible in
generated code; these observations motivate joint loop/representation planning,
not a global cap8 default. All negative results are archived. Separate small
GPU correctness probes pass, but alternating E2E stalls still disqualify the
TIRx/MPS diagnostic cohort from stable performance comparison or cost fitting.
The indexable-operand follow-up
couples newly rolled K loops to definition-time operand storage in the shared
resource plan. MHA adds 256 B per worker; all six default-cap LLVM/ORC objects
remain byte-identical to the previous checkpoint. Seventy-two new balanced
visits reduce the MHA regression to about 7%–10% versus the same-cohort
default, while prefill remains about 43% slower. This repairs a representation
interaction, not a universal speedup or a new Torch/MPS comparison. Default
policy and the explicit unmodeled-cost status are unchanged.
The strided-RHS MMA grouping experiment
allows independent output grouping when the left operand broadcasts and the
right operand has a non-unit stride. In 72 new native-entry visits, R4 reduces
time by about 3.5% for ragged decode and 4.3% for cap0 prefill. Cap8
prefill improves about 21%, but still trails the expanded-cap configuration;
MHA gains are small and two ranges cross parity. Capacity and bitwise outputs
match within each R1/R4 pair. This compares complete grouping choices, not
old-R4/new-R4 or Torch/MPS. Four relevant CTests pass; defaults stay unchanged.
The subsequent MMA work-model checkpoint
aligns the planner with admitted grouping and cap-dependent snapshots. It
distinguishes constant SSA projections from dynamic indexed reads and exposes
unweighted contraction/loop work to backend cost policies. Four CTests and
seven exact-name host checks pass, including 441 planner configurations.
This is a cost-extraction correction, not a new timing result or automatic
R/cap search. Native mask, code-size and cache effects remain uncalibrated;
the performance comparisons above are not revised using model scores.
The two-dimensional MMA experiment
adds an opt-in 2×2 candidate within the same four-accumulator budget as 1×4.
Admission uses complementary output-axis broadcasts, not operator names;
each output retains its K order, flat layout and snapshot semantics. In
72 new native-entry visits, five prefill/batch/GQA configurations reduce
paired time by 2.2%–10.6%. The decode control retains byte-identical
LLVM/ORC code and its ratio range crosses parity. All full outputs pass an
independent FP64 oracle and bitwise A/B checks; resource capacity and root
mapping match. Actual full-packet clone availability is unchanged in every
pair. Four CTests and seven exact-name host checks pass. Default selection
is unchanged; this is neither automatic cost calibration nor a new
Torch/MPS/Metal4 performance comparison.
The native attention reference experiment
compares the actual Tile ORC entry with handwritten online NEON and dense
Accelerate GEMV/GEMM at six shapes, including KV=8193, GQA and channel tails.
All 144 visits / 1008 samples pass full independent FP64 checks and guards.
At the three decode shapes, NEON takes 0.151–0.237× Tile time and Accelerate
0.114–0.172×, using the same native timer and confirmed calling-thread BLAS
single-thread setting. These are diagnostic references, not compiler gains:
the algorithms, reduction order and storage differ, and the host is not fully
quiescent. They motivate separate contribution/output-axis realizations and
explicit layout/call/packing costs; no automatic policy, Torch/MPS result or
production default changes in this checkpoint.
The compiler-generated native MMA experiment
implements typed XIR contraction metadata and same-module private SIMD vector
helpers, using contribution-axis vectors for QK and output-axis vectors for PV.
Unlike the handwritten references, this is actual Tile compiler code. In six
matched native-entry cohorts, batch GQA reduces paired time by 25.8%, but
the other five increase it by 6.2%–60.4%. All 72 visits / 504 samples pass
complete FP64, input/guard and own-capture bitwise checks. Authorized QK
reassociation means A/B outputs need not be bitwise equal.
All on candidates increase snapshots and reduce packet-interleaved arrays;
prefill-q8 additionally acquires a full-packet clone. These are complete
realization comparisons, not isolated arithmetic speedups. The costs of
layout transitions, snapshots and code remain uncalibrated, so the candidate
stays opt-in with native_mma_cost=unmodeled. Eleven selected CTests and
23 changed-TU syntax checks pass after a full selected build; historical
failed attempts remain archived. There is no new Torch/MPS/Metal performance
claim or automatic policy promotion.
The subsequent native attention phase profile
samples the same frozen native images, separately from performance timing.
MHA-on’s two K/V definition-snapshot copy loops account for about 84.9%
of raw timer observations; the long-KV-on copy loops account for 81.5%.
The MHA-on loops perform
masked scalar gathers/scatters across programs despite contiguous elements
within each tile. This prioritizes a generic contiguous snapshot-transfer
realization coupled to the MMA layout, ahead of arithmetic-only tuning.
The six sampled runs pass pre/post numerical and guard checks; samples have
incomplete unwinding and are not new speedup measurements, memory-bandwidth
counters or evidence that the attributed cost can all be eliminated.
The follow-up contiguous snapshot-copy experiment
implements generic layout-based admission, typed XIR transfer semantics and
same-module SIMD vector copies at the original load definition. It preserves
logical bounds/fallback and snapshot semantics without adding a DSL primitive.
With native MMA fixed on, three decode cases reduce paired native-entry time
by 70.2%–78.8%, prefill-q4 by 25.8%, and batch GQA by 50.4%.
Prefill-q8 instead regresses 2.6%, accompanied by loss of its full-packet
clone. All 72 visits / 504 samples pass complete FP64, input/guard and
bitwise A/B checks. Snapshot capacity, allocation count, private interleaving,
workspace, root order, task grain and entry ABI match within every pair.
Eleven selected CTests and 25-TU syntax checks pass after the complete selected build. The copy capability and conditional full-path/fallback work are exposed to backend policies, but the candidate remains off by default with unmodeled cost. Joint transfer/compute/layout/code-budget selection and held-out non-attention performance remain unfinished. These whole-realization ratios do not isolate vector-load latency, compare against the earlier MMA-off baseline, or establish fresh Torch/MPS/BLAS parity.
Metal4 XIR route: correctness established, timing not yet stable
The September 10 target-info checkpoint
adds the distinct TileIR -> XIR -> LLVM/AIR -> Metal4 Runtime route, not MPP
or TIRx. Five selected CTests pass: TileIR, backend target info, Metal4 rows,
SIMD Runtime and SIMD LLM, plus two subprocess checks for fatal invalid-attention
inputs after integrating the latest next test helpers. Metal4 checks 41 FP32 instances plus five expected
rejections, with full outputs, unchanged inputs and guards. The generic bridge
checks physical 32/64-lane contracts; this machine executes only W32.
Nine 128×1024 RMSNorm/softmax/SwiGLU probes retain all raw synchronized Runtime host-wall samples. Automatic search selects the W32 mapping in each case, but identical selected physical plans have highly inconsistent timing between fixed and automatic requests (about 59× in the SwiGLU probe, which also used different adaptive batch counts: 1 versus 119). These are diagnostic records, not a ranking, cost calibration, pure-kernel measurement or evidence of Torch/MPS parity. The independent Metal4 timing extension now has executed counter/feedback correctness coverage; stable fixed-batch comparisons, Runtime attribution and cost calibration remain separate gates. The tested CPU regressions deliberately avoid loading TVM’s LLVM21 and the native backend’s LLVM22 into the same process; standalone TIRx builds remain enabled.
Metal4 timing separates device intervals from host completion
The independent Metal4TimingExt records precise per-dispatch timestamps,
feedback-only command-buffer controls and host submission/retirement boundaries.
The M1 Max timestamp heap executed successfully at 24 MHz. These are instrumented
dispatch intervals, not zero-overhead kernel times; clocks and separately sampled
phases must not be subtracted as a single event decomposition.
The timing implementation and recovery checkpoint
retains the staged correctness runs (six timing cases / 8,515 assertions after
the boundary fix), completed 18-visit pilot, and interrupted 144-visit row matrix:
35 OK, two Error, 107 NotRun.
The two errors are single-lane 1024×4097 LayerNorm/softmax snapshot-budget
rejections; corresponding W32/automatic requests execute. This motivates
per-candidate resource admission, not a larger universal lane/storage constant.
The interrupted matrix and noisy same-realization observations do not establish
a new performance ranking, calibrated policy or Torch/MPS parity.
Native pointwise replay separates fusion benefit from code growth
The September 10 native pointwise checkpoint
compares the existing guarded pointwise-fusion implementation off/on and
frozen TorchInductor entries. It changes no production compiler code: the
measurement source is 202955f7d plus a correctness test. W8/local=8/block=32,
one CPU thread, precise math and the other realization switches remain fixed.
This is a native-entry A/B experiment, not automatic planner selection.
The completed 24-case matrix uses four shapes through 1024×4097 (RoPE rounds odd widths up to even), in all six off/on/Inductor orders. These ranges span the four cases’ paired median time ratios, not confidence intervals; lower is better. Wins count within-round on/Inductor comparisons.
Operator |
On/off |
On/Inductor |
Wins |
|---|---|---|---|
RMSNorm, identical-object control |
0.993–1.015 |
0.344–0.457 |
24/24 |
LayerNorm |
0.870–1.457 |
0.376–1.084 |
18/24 |
Masked softmax, identical-object control |
1.000–1.003 |
1.344–1.638 |
0/24 |
SwiGLU |
0.883–0.943 |
1.032–1.172 |
0/24 |
GELU + residual |
0.940–0.978 |
0.553–0.632 |
24/24 |
RoPE |
0.527–1.702 |
0.880–2.370 |
11/24 |
Large RoPE (1024×4098) takes 0.695× off time / 0.880× Inductor time;
all six rounds win both comparisons. The negative cases remain:
17×66 RoPE regresses to 1.702× off, and 17×65 LayerNorm to 1.457×;
both lose all six rounds. SwiGLU improves at every size but still loses all
24 comparisons with Inductor. The eight RMSNorm/masked-softmax off/on ORC
objects are byte-identical; their timing changes are not fusion benefits.
All absolute times, paired ranges and wins are in the 24-case tables.
All 432 native visits pass full-output, input and guard checks. An independent audit rereads 72 native outputs at their original locations, recomputes the FP64 oracle and statistics, verifies 1,413 artifact/runner identity entries, and rejects 11 evidence mutations. Guards were checked at execution, not retained for post-hoc rereading. These are native-entry host-wall times: Runtime/Python/JIT/caller allocations are excluded; necessary traversal, resets and compiler-emitted libc/internal allocations remain. The repository preserves actual entries, objects, LLVM and audit records, but excludes tensor payloads; the recorded output audit is not a claim that the repository archive alone can rerun it without the original temporary data.
The separate four-case pilot and its 72 visits are retained, not pooled into the matrix: its small RoPE regresses to 1.708× off, large RoPE takes 0.627×, and SwiGLU improves but still loses to Inductor. Its revised audit verifies 12 outputs / 253 identity entries / 11 mutations; the earlier seven-mutation audit is preserved unchanged. Pilot and matrix numbers are not interchangeable.
Actual object code confirms one four-input/two-output loop for the large RoPE non-alias fast path and no snapshot-copy calls in the SwiGLU fast paths. Alias-safe fallbacks and their reserved storage remain. Small RoPE’s fused helper is not inlined and its whole-entry code/frame size grows; this is a testable profitability hypothesis, not measured cycle attribution.
Desktop background load is recorded, not claimed absent. Both current Tile variants use LLVM22; their off objects differ from the September 9 LLVM21 archive. Do not splice absolute timings across those compiler identities. This fixed-candidate evidence neither changes defaults nor calibrates costs, and makes no new Runtime, Metal, MPS or cross-route performance claim.
Tail-code and specialization experiments remain negative
The September 10 outlined-tail experiment
retains 24 cases / 432 visits with both pointwise fusion and full-packet
specialization enabled. Only the real narrow-tail call-site NoInline
policy differs. It does not establish a broad improvement; small RoPE
regresses 4.62% in paired median time, losing all six rounds even though its
wrapper frame shrinks from 2368 to 112 bytes. The candidate was withdrawn;
its exact patch, tested source and actual native objects remain archived.
This is not a deployed planner or compiler optimization.
The separate six-case specialization-disabled experiment
also retains its negative results. All six fusion-on cases lose all six
paired rounds against Inductor. Its A/B variable is still pointwise fusion,
not specialization: do not divide times across these separate cohorts to
claim a causal specialization effect. Together, the code evidence motivates
distinguishing dynamic tail frequency, full-packet constant propagation and
cold-code/frame impact in backend realization policy. Code size or stack
size alone is not an adequate profitability model.
Both experiments use fixed-candidate single-thread native-entry host-wall timing under recorded desktop background load, not default-planner E2E or quiet-machine measurements. The archives omit tensor payloads and are not self-contained numerical replay packages.
Native row entries expose both broader wins and remaining gaps
The September 9 six-operator native report
extends the existing private-index checkpoint to 24 fixed FP32 cases,
without changing the compiler or fitting a new cost policy. Actual SIMD ORC
entries and TorchInductor 2.14.0 entries run through a common single-thread
C++ callback timer, in all six orders. The first three operator families win
all 72 paired comparisons; the other three lose all 72.
Each range below spans the four shapes’ paired median Tile/Inductor time ratios, not a confidence interval. Lower is better. Shapes are 17×65, 129×768, 257×1538 and 1024×4097; RoPE rounds the odd widths up to even. Local=8, packet W8 and block=32 are fixed; full-packet, predicated effects and cohort-private access are on, load/reduction fusion and fast math are off.
Operator |
Time ratio |
Wins |
|---|---|---|
RMSNorm |
0.337–0.469 |
24/24 |
LayerNorm |
0.374–0.735 |
24/24 |
GELU + residual |
0.568–0.645 |
24/24 |
Masked softmax |
1.350–1.607 |
0/24 |
SwiGLU |
1.166–1.244 |
0/24 |
RoPE |
1.247–1.944 |
0/24 |
All 24 whole/local/Inductor times, six-order ranges and mapping comparisons
remain in the complete tables.
These are native-entry host-wall times, not Runtime latency or hardware
cycles. Runtime/Python/JIT and caller allocations are excluded; actual entry,
callback, necessary traversal/launch resets and compiler-emitted libc or
internal allocations remain. In particular, Inductor allocates a width-sized
scratch inside each masked-softmax entry; it is not moved outside timing.
Alignment is fixed at 64 bytes. Do not splice these timings into older cohorts
with different replay helpers or alignment.
The wrapper parser recovers real FX input order, pointer constness, reused
scratch and partitioned output aliases. It rejects unknown effects or ABIs;
the C++ helper contains no operator implementation. Every one of 432 native
visits checks full FP64 output tolerance, input immutability and guards. The
independent audit
rereads all 48 capture outputs and 72 unique native snapshots, recomputes
statistics, and rejects nine evidence mutations. Guard arrays were checked
during replay, not retained for later rereading.
Numerical differences remain explicit: Tile LayerNorm uses centered-square
reduction while large-width Inductor uses Welford; wide-row Inductor retains
cascade reductions. Both GELU graphs use the tanh approximation but different
math implementations. FP64 checks use atol=rtol=5e-5 on the same deterministic
finite inputs, not cross-framework bitwise equality or an all-domain accuracy
guarantee.
In the archived September 9 entries, actual RoPE C++ shares four input vectors across two stores in one loop, while the XIR bridge materializes loads and multi-consumer values, deferring only pure single-use arithmetic. This motivated the guarded shared-DAG fusion candidate measured separately above, followed by softmax phase/materialization search. It is static code evidence, not measured hardware bottleneck attribution. GELU’s win also rules out a blanket claim that every transcendental path is slow. Realization-sensitive cost calibration and independent CPU task grain remain open. This fixed opt-in cohort establishes neither automatic/default-path parity nor new Metal/MPS/BLAS/GEMM/attention performance.
Late native codegen probes separate address demand from inlining
The later September 9 Chinese codegen investigation
captures two independent 24-case experiments from 2cfc80493: forced
packet-loop inlining, and a separate late integer-lane projection prototype.
Both use actual ORC objects and the same frozen Inductor entries, with fixed
W8/local=8/block=32, precise math and existing opt-in pointwise realization.
Both complete timing cohorts are diagnostic-only under desktop coactivity;
they do not replace the accepted native ratios above or calibrate a policy.
Actual RoPE objects expose vector integer work and register transfers for an address needing only one scalar lane. The projection prototype removes that work without rewriting FP arithmetic, duplicating loads or matching operator names. Packet-loop inlining instead removes helper calls and hoists guards to once per block; its diagnostic small-RoPE benefit coexists with large LayerNorm regressions. These are different decisions, not a blanket argument for inlining or evidence that the execution solver is now calibrated.
All 864 timed native visits pass the recorded full-output checks; an
independent audit rereads 384 output snapshots across captures, smoke and
timed cohorts. The two experiments retain all diagnostic tables.
The temporary C++ overlays remain outside the working compiler: demanded-lane
profitability, poison/undef and code-growth tests, joint decisions and unseen
program holdouts still precede production promotion. See the
validation boundary.
Use-site private indices unlock contiguous SIMD memory
The September 9 private-index report
closes the previously measured ragged RMSNorm gap at fixed local mapping.
It carries an existing use-site equality fact into private-memory realization,
without globally scalarizing varying state or adding an operator-specific rule.
The feature remains opt-in, and the automatic cost model is not recalibrated.
The single-thread native-entry experiment compares the actual ORC and TorchInductor 2.14.0 entries, with six balanced orders and seven samples per visit. Runtime/Python/JIT/allocation are excluded; required native traversal, launch-record resets and emitted libc calls remain. W8/local=8/block=32 are fixed, predicated effects and full-packet specialization are on, fusion and fast math are off. Only the new private-index feature changes on/off.
RMSNorm |
Off µs |
On µs |
Inductor µs |
On/off |
On/Inductor |
|---|---|---|---|---|---|
17×65 |
1.364 |
0.249 |
0.729 |
0.182 |
0.340 |
257×1538 |
544.018 |
116.720 |
247.348 |
0.213 |
0.469 |
1024×4097 |
5784.021 |
1148.873 |
2593.370 |
0.198 |
0.442 |
129×768, aligned control |
26.311 |
26.238 |
63.246 |
0.998 |
0.416 |
137×1023, new shape |
193.905 |
40.881 |
86.733 |
0.211 |
0.471 |
513×2051, new shape |
1456.840 |
283.972 |
655.054 |
0.197 |
0.436 |
All 36 paired rounds beat Inductor. Five ragged cohorts improve another 4.7–5.5× over the preceding implementation. The aligned control has identical LLVM/object bytes; its existing win and tiny timing movement are not a new optimization benefit. Inductor still uses reciprocal-multiply and a cascade reduction at width 4097; Tile keeps division. Both pass a complete FP64 tolerance check, not a cross-implementation bitwise-equivalence contract.
The separate 440-visit Runtime E2E experiment covers six row operators at nine dimensions and two attention shapes. These examples fix local=8 and 1024 rows, with width 4097 (4098 for even-width RoPE), at eight requested CPU workers. They show cross-operator lowering benefits, not native Torch parity.
Operator |
Off µs |
On µs |
On/off |
|---|---|---|---|
RMSNorm |
889.739 |
307.457 |
0.346 |
LayerNorm |
1739.144 |
413.998 |
0.238 |
Masked softmax |
3661.417 |
1913.912 |
0.531 |
SwiGLU |
1566.149 |
934.094 |
0.597 |
GELU + residual |
2513.825 |
1566.668 |
0.624 |
RoPE |
1179.285 |
450.866 |
0.383 |
Negative results remain: 17×65 RMSNorm local E2E grows 30.472→32.095 µs
(paired 1.053), despite the native win; whole-program on is 1.335 µs.
Aligned 64×256 LayerNorm local and new 137×1024 RoPE local measure paired
1.046/1.048. Their object identities were not captured, so neither a code
regression nor a pure-noise explanation is established. Attention has no
consistent improvement. Two E2E orders and their ranges are descriptive,
especially for the noisier softmax/whole-program cases. See all 110 fixed
mapping comparisons in the complete tables.
The audit
rechecks all 452 Runtime/capture outputs; 116 fixed-mapping groups preserve
exact output bits. All 108 native visits check complete outputs and guards.
Initial broad CTest is 205/209, including 64/64 SIMD/Tile XIR tests; the two
Metal timeout cases pass unchanged on recheck, while two tutorials require
the absent fallback backend. Feature-on W2/W8/W16 Runtime checks pass.
Actual full-range assembly replaces per-lane private loads with ldp q and
stp q. This is static code evidence plus a controlled timing comparison,
not sampled hardware bottleneck attribution. Mapping and the estimated
62030848 relative work stay unchanged for 1024×4097 despite the native
improvement. Epoch-scoped access facts
need to inform realization-sensitive cost policy and task-grain search.
This does not establish automatic/default-path, all-operator or Metal/MPS/BLAS parity.
Ragged control flow is a realization cost, not extra Tile work
The September 8 ragged-CFG report
adds generic masked memory triangles and use-site cohort-equal counted-loop
headers. At fixed mapping this turns eligible state-machine programs into
direct CFG, enabling the separate full-packet clone. It changes neither
reduction order nor Tile semantics and remains off by default.
The new single-thread native-entry comparison uses actual ORC objects and TorchInductor 2.14.0 generated C++ entries. All six orders, seven samples per visit, no Runtime dispatch/Python/JIT/allocation inside timing. Packet-only baselines retain the required block traversal in the C++ replay; block-batch candidates use their actual emitted entry. Native call, launch-record reset and emitted libc work stay inside the timer. This is not a hardware-cycle counter or a claim that entry overhead has been removed.
RMSNorm |
Off µs |
On µs |
Inductor µs |
On/off |
On/Inductor |
|---|---|---|---|---|---|
17×65 |
9.508 |
1.334 |
0.714 |
0.140 |
1.869 |
257×1538 |
1818.533 |
526.531 |
236.831 |
0.290 |
2.224 |
1024×4097 |
18361.792 |
5645.630 |
2531.710 |
0.308 |
2.230 |
129×768, aligned control |
25.616 |
25.579 |
59.315 |
0.998 |
0.431 |
All 18 ragged paired rounds improve, and all 18 still lose to Inductor. The aligned control’s LLVM/object bytes are unchanged; its existing win is not a new optimization benefit. Torch retains reciprocal-multiply and its wide-row cascade reduction, while this Tile program keeps division; both pass the same complete FP64 tolerance check, not a bitwise-equivalence test.
The separate 344-visit Runtime E2E screen covers all six row operators and two attention shapes at eight requested workers. These fixed-local=8, 1024-row examples use width 4097, or 4098 for even-width RoPE. Ratios are same-round paired medians; two orders do not establish confidence intervals.
Operator |
Off µs |
On µs |
On/off |
|---|---|---|---|
RMSNorm |
2623.024 |
859.845 |
0.329 |
LayerNorm |
4652.261 |
1610.669 |
0.346 |
Masked softmax |
6290.556 |
3025.538 |
0.481 |
SwiGLU |
3223.042 |
1407.687 |
0.437 |
GELU + residual |
4078.573 |
2268.784 |
0.556 |
RoPE |
3055.139 |
1003.560 |
0.328 |
This generalizes the lowering mechanism, not automatic mapping profitability:
17×65 RMSNorm still costs 28.119 µs E2E locally versus 1.276 µs whole-program.
Aligned 64×256 GELU local measures 55.312→59.552 µs (paired 1.082);
attention has no new local path or consistent improvement. Full shapes,
negative results and descriptive ranges remain in the
complete tables.
The audit
independently rechecks all 352 Runtime/capture outputs; 72 native visits each
check complete outputs and guards during replay. Ninety fixed-mapping groups
preserve exact output bits. All 66 Tile/SIMD CTests and opt-in Runtime checks
at W2/W8/W16 pass. ABI preflight failures are retained separately and the
complete native experiment was rerun after correcting the replay helper.
Actual Torch sources split the contiguous vector interval from the masked tail. Luisa’s emitted assembly still contains per-lane private loads in full-range loops: header equality does not yet establish common-slot equality at each memory use. This motivates epoch-scoped access facts and full/tail partitioning, not global scalarization. The fixed mapping’s uncalibrated cost is identical on/off despite the large native difference; realization-sensitive model calibration remains pending. No new Metal, MPS, BLAS or non-RMSNorm native Torch result, default win or all-kernel parity is claimed.
CPU task grain is independent of the native packet body
The September 8 task-grain report
adds an independent blocks-per-CPU-task search and replaceable XIR cost policy.
This is a Runtime scheduling change, not a new native kernel speedup:
18 fixed-mapping cohorts have byte-identical LLVM, ORC objects and outputs
across four task grains. All 592 comparative visits pass complete FP64
output checks; a separate final-binary pilot is retained without merging its
timings into these cohorts.
At fixed FP32/W8/local=8/block=32, the same 129×768 shape needs different task policies for different primitive mixes. Times are Runtime E2E µs, with eight requested CPU workers, full-packet specialization on and fusion off. Caller executes the entire range on the submitting thread. Ratios are paired medians from two orders; they are descriptive, not confidence intervals.
129×768 |
Legacy grain |
Caller |
Caller/legacy |
|---|---|---|---|
RMSNorm |
52.909 |
25.662 |
0.486 |
LayerNorm |
62.951 |
42.272 |
0.672 |
RoPE |
56.531 |
27.680 |
0.490 |
Masked softmax |
85.638 |
227.854 |
2.661 |
SwiGLU |
73.753 |
132.546 |
1.797 |
GELU + residual |
86.084 |
239.004 |
2.776 |
A provisional activation-cost extension improves pilot RMSNorm 64×256 from 34.100 to 5.544 µs and small attention B,Hq,Hkv,Q,K,D,Dv=1,4,2,16,32,16,16 from 35.189 to 14.872 µs. Attention still uses whole-program mapping, not a new local attention realization. The extension is not a validated default: LayerNorm 4096×1024 regresses from 359.189 to 389.362 µs under a coarser parallel grain, and ragged 257×1538 norm/softmax still select slow local state-machine paths. On RMSNorm 17×65, selected local takes 9.637 µs while whole-program takes 1.299 µs. A semantic work count does not capture this realization difference.
The coefficients are prespecified relative-work priors, not fitted time or
hardware facts. The full tables
and audit
retain all seven operators, 26 extended shapes and negative results. Future
policy work must combine actual CFG/mask/math realization with task overhead
and load-balancing risk. No new Torch/MPS/BLAS measurement, automatic default
win or all-kernel parity is claimed.
Full-packet specialization changes the profitable local mapping
The September 8 full-packet report
separates a backend codegen decision from Tile fusion and execution mapping.
One bounded internal clone receives constant active-lane count W; the
original packet body still handles genuine tails. No operator-name rule,
reduction-tree change or reciprocal rewrite is used. Both this candidate and
local mapping search remain opt-in; this is not yet a calibrated default
solver.
Packet-local RMSNorm now beats one-thread TorchInductor in two native-entry cohorts. This table holds fusion off and mapping fixed within each row. P=0 uses the ordinary packet body; P=1 adds the full-packet clone. Times are µs, from six balanced orders and seven samples per visit; Torch is remeasured independently for each row. Ratios are medians of paired rounds.
RMSNorm |
Mapping |
P=0 |
P=1 |
Inductor |
P1/P0 |
P1/Inductor |
|---|---|---|---|---|---|---|
64×256 |
Whole program |
11.404 |
11.406 |
9.123 |
1.000 |
1.250 |
64×256 |
Packet-local |
14.593 |
5.334 |
8.840 |
0.366 |
0.603 |
1024×4096 |
Whole program |
3251.837 |
3251.474 |
2185.154 |
1.000 |
1.489 |
1024×4096 |
Packet-local |
3293.971 |
1117.151 |
2184.957 |
0.339 |
0.511 |
All 12 paired no-fusion packet-local comparisons beat Inductor. The replay
links the actual ORC objects, excludes Runtime/Python/allocations/thread-pool
dispatch, and retains the native call, launch-record reset and LLVM-emitted
system memcpy. It is native-entry wall time, not a cycle counter. The first
no-import replay stopped at memcpy; all eight factorial cells were rerun
with an explicit libc-only allowlist. That preflight is retained separately.
The complete native factorial has 144 correct visits. With fusion on, specialization also helps, but local 1024×4096 is 2091.677 µs versus 1117.151 µs without fusion; its paired Inductor ratio is 0.957 with one of six rounds losing. Removing the snapshot is still not the best measured realization. Whole-program paths still lose to Inductor. Math differences remain explicit: Torch uses reciprocal-then-multiply where this Tile program uses division.
The separate 240-visit Runtime E2E screen covers six operators and 15
shapes at eight requested CPU workers. With fusion off and local mapping
fixed, RMSNorm 1024×4096 improves 706.820→307.779 µs, LayerNorm
1024×4096 1093.969→449.250 µs, softmax 64×4096 191.515→168.982 µs,
and GELU 1024×4096 2984.755→2137.794 µs. These are not new Torch comparisons
for the other operators. SwiGLU has no consistent improvement, and narrow
17×65 RMSNorm remains far slower under local mapping: 37.690 µs versus
1.314 µs whole-program. This is evidence that CPU task grain still matters.
Two E2E orders do not establish a confidence interval; complete ranges,
negative controls and failures are retained in the
audit.
The compiler change leaves all eight disabled-candidate RMSNorm LLVM/object captures byte-identical to the previous checkpoint. Native assembly confirms a distinct constant-width body and contiguous copy realization; static instruction counts are not measurements of branch stalls or spilling. The cost model needs separate full/tail realization costs jointly with distribution, fusion and task grain. No new Metal/MPS/BLAS result, automatic default victory or all-kernel parity is implied.
SIMD local distribution and private layout are separate decisions
The earlier September 8 load/reduction fusion report
adds a legal first-consumer realization and matching work accounting, but
leaves it opt-in and default-disabled after measured regressions.
It follows the private-vector improvement
and mapping/layout experiment.
The previous contiguous private-access optimization remains enabled.
The rule moves a load into its first closed unordered reduction only across read-only operations and unit map wrappers, with pointwise dimension correspondence. It retains the snapshot for later users and rejects every intervening write or stage boundary, without parameter-name/noalias assumptions. This is a generic realization, not a new DSL or a calibrated automatic fusion solver.
Fewer counted private reads did not improve native RMSNorm. Each row is a fixed-mapping no-fusion/fusion/Inductor experiment with the same private layout and vector-access policy: one CPU thread, all six orders, seven samples per visit. Times are µs; separate rows remeasure Torch independently.
RMSNorm |
Mapping |
No fusion |
Opt-in fusion |
Inductor |
Paired fusion/default |
|---|---|---|---|---|---|
64×256 |
Whole program |
11.087 |
13.521 |
8.869 |
1.219 |
64×256 |
Packet-local |
14.323 |
17.164 |
8.847 |
1.198 |
1024×4096 |
Whole program |
3205.413 |
3749.899 |
2147.740 |
1.170 |
1024×4096 |
Packet-local |
3233.376 |
3967.917 |
2146.697 |
1.227 |
All 24 paired fusion/default comparisons are slower. Actual-object C++ replay excludes Runtime, Python, allocation and thread-pool dispatch, retaining the native call and launch-record reset; it is not a cycle counter. All 72 native visits pass complete output and guard checks. Default SIMD still loses to Inductor; no new MPS/BLAS/Metal result is implied.
The separate 120-visit Runtime E2E experiment covers 15 shapes/operators,
eight requested CPU workers and two orders. Whole-program one-row RMSNorm
and LayerNorm improve to paired ratios 0.828/0.936, but multirow norm cases
generally regress; 1024×4096 RMSNorm is 1.198/1.211 for whole/local mapping.
Softmax, SwiGLU, GELU and RoPE do not trigger this fusion rule; their recorded
variation must not be presented as fusion speedups. Full times, ranges and
negative controls are in the audit.
The counterexample identifies a missing interaction in the model: the 64×256 whole-program work score falls 297112→231576, but LLVM changes from an inlined body to an outlined packet call. The actual native text has more conditional-branch sites; static sites do not establish branch stalls or spilling as the sole cause. Full-packet specialization/inlining, partial count, fusion and task grain need joint evaluation, not an unconditional memory-work discount.
Whole-program mapping and private vectors remain default; joint mapping search and this fusion remain opt-in. The shipping policy change is recorded separately from the frozen experimental binary and verified against shipping captures. Numerical policy is unchanged: Torch uses reciprocal-then-multiply where this Tile expression uses division. General phase fusion, masked-memory cost calibration and independent CPU task grain remain open.
Bounded XIR traversal improves compilation, not yet Torch parity
The next September 8 bounded-representation report
implements runtime loops for large Tiles, single-use pure expression recipes,
closed unordered partial accumulators and CPU-thread-owned private workspace.
Load snapshots, simultaneous loop carries and strict folds remain intact.
The planner counts the new representation’s work, but still searches only
root order/block width; this is not a calibrated local-distribution solver.
Native-entry timing now isolates Runtime/Python. For the same 64×256 RMSNorm inputs, a single-thread C++ replay of actual generated objects gives:
Native entry |
Median µs |
|---|---|
Previous indexable XIR |
98.570 |
Bounded XIR |
28.836 |
One-thread TorchInductor |
8.995 |
All six orders, seven samples per visit, full FP64 outputs and guards pass. This excludes Runtime, Python, allocation and thread-pool dispatch, but retains native-call/loop overhead and Luisa’s small mutable launch-record reset. It is single-thread native-entry wall time, not hardware cycles or an eight-thread E2E comparison. The approximately 3.42× improvement still leaves XIR at 3.21× Inductor’s time. Actual object text shrinks 262772→11564 bytes; the 64×256 native frame shrinks 37376→17056 bytes.
Separate AB/BA Runtime batches improve RMSNorm 17×127, 64×256, 1024×256 and 64×513 by 1.50–2.43× over the previous XIR, and LayerNorm 64×256 by 1.59×. However, masked softmax 17×65 regresses 3.878→8.390 µs and SwiGLU 4.373→5.644 µs. The fixed 64-element cutoff is a code-size policy, not an optimal performance choice. All 32 visits pass; two orders are descriptive, not confidence intervals. Ordinary RMSNorm 64×256 JIT falls 5806.4→80.7 ms, kept separate from execution time.
The expanded large-shape matrix now completes all 44 native/Torch visits, including widths 1537/4096/16384 and seven operator families. Every one of the 11 matched cases still loses to eager Torch: XIR/Torch E2E ratios range 1.49–23.32×; the worst is LayerNorm 17×16384. Three failing pre-workspace cases remain in the raw evidence, alongside the successful resource repair. No Metal, MPS or BLAS improvement is claimed by this CPU change.
There are two distinct remaining mapping gaps: lane packing still spans rows
instead of continuous features; and 17/64 row programs with 32 workers/block
expose only 1/2 CPU block tasks despite requesting eight workers. Independent
packet task grain, local-vector distribution and phase materialization need
real candidates before their costs can be fitted. The full isolated build and
38 selected Tile/SIMD CTests pass. See the audit
for separate timing boundaries, full tables, checks and retained failures.
Indexable XIR snapshots remove quadratic extraction work
The September 8 snapshot implementation report
turns the Torch inspection below into a generic Tile-to-XIR representation
repair: compile-time coordinates project scalar SSA directly; runtime-indexed
Tiles receive definition-time local snapshots and guarded indexed reads.
The planner’s work prior now accounts for stores and reads instead of charging
a full SELECT chain for each reduction iteration. No operator-name dispatch
or new DSL Memory annotation is involved; the root candidate family is unchanged.
Two balanced orders, seven samples per visit, fixed W8/requested eight CPU workers, and unchanged per-case block/order plans give these old-XIR/new-XIR warm synchronized Runtime batch results. All 32 visits pass native full FP64/guard checks and independent Python FP64 comparisons. This is neither pure CPU kernel timing nor a new Torch/MPS comparison.
Operation / shape |
Old XIR (µs) |
New XIR (µs) |
Paired old/new |
|---|---|---|---|
RMSNorm 17×7 |
0.392 |
0.335 |
1.170× |
RMSNorm 17×127 |
29.492 |
8.140 |
3.623× |
RMSNorm 64×256 |
225.980 |
87.514 |
2.582× |
RMSNorm 1024×256 |
874.441 |
268.943 |
3.252× |
RMSNorm 64×513 |
768.288 |
144.550 |
5.315× |
LayerNorm 64×256 |
390.033 |
117.339 |
3.338× |
Masked softmax 17×65 |
11.688 |
3.875 |
3.017× |
SwiGLU 17×65, no dynamic extraction |
4.356 |
4.293 |
1.015× |
The reduction improvement repeats across both orders. The approximately 1.5%
SwiGLU difference is a control observation, not attributed to this transform.
Two orders are descriptive evidence, not confidence intervals or broad
generalization. This patch combines constant projection and dynamic snapshots;
it does not separately attribute their gains. Source, binary and input
fingerprints are retained with the raw A/B.
Compilation and resource costs regress. At 64×256 RMSNorm, ordinary JIT medians rise from 3.645 to 5.684 seconds. Actual ORC machine code replaces the 256-choice-per-iteration chain with an indexed load loop, but object text grows from 214252 to 262772 bytes and the kernel frame from 33104 to 37376 bytes. Local arrays still use per-worker gather/scatter and whole-row expansion. At 64×513, JIT rises from 14.851 to 24.113 seconds despite the throughput win.
Separate probes at 17×1537 and 1024×4096 time out at 60 seconds for both
versions; 64×16384 hits the SSA expansion budget. None has a completed output
or throughput result. Samples identify normal ORC compilation in MachineSinking
and MachineCSE, not the prior extra assembly-copy path. Failed probes remain
in the large-shape record.
The full isolated Tile suite passes 35/35; additional complete Runtime tests
pass at W1/2/4/16 with 728 assertions each. Coverage includes strict folds,
aliased const/writable inputs, dynamically indexed multi-element carries,
zero-trip loops and tails. The independent audit
recomputes timing summaries and verifies the actual code loop separately.
Next work is bounded local-vector distribution,
phase liveness and explicit JIT/runtime objectives—not merely cost-weight tuning.
Torch CPU code inspection exposes missing local-vector candidates
The September 8 CPU SIMD inspection
examines the installed Torch 2.14.0 binary, sampled ATen/Accelerate call paths,
and actual Inductor-generated C++/ARM64 code. At 1024×4096 and 64×256,
Softmax/RMSNorm/SwiGLU compiled outputs pass complete eager comparisons.
Torch’s DEFAULT capability still emits 4-wide NEON; eager Softmax calls
vector SLEEF, while eager RMSNorm is composite despite its internal name.
Sampled GEMM calls Accelerate SGEMM; this does not identify its hidden ISA.
In the pre-repair 64×256 capture, direct XIR RMSNorm retains a 256-choice SELECT chain inside a 256-iteration reduction in the actual machine code. Its object has 214252 bytes of text and the kernel frame reserves 33104 bytes. SwiGLU already uses the native v8 exp provider, but statically duplicates 256 call sites; its object text is 345696 bytes. These are code-shape diagnostics, not speedup ratios. Both XIR cases pass full FP64/guard checks. The larger RMSNorm assembly-copy diagnostic was terminated after more than six minutes in LLVM MachineSinking; it is retained as incomplete, not labeled kernel time.
The missing family is bounded local-vector distribution,
with indexable compiler-owned values, contribution/output partition factors,
and phase-specific materialization. Root-order/block-width weights cannot
create that family. Existing vector math should be reused; no production
planner change or new performance ranking was part of the inspection itself.
The subsequent snapshot repair and its measured tradeoffs are recorded above.
The evidence checker
keeps provider identity, successful comparisons and the incomplete diagnostic
separate from timing claims.
Composed reductions need phase-specific contraction distributions
The September 8 decode study separates a previously coupled control: enabling subgroup candidates also attempts immutable input-view forwarding and changes automatic group width. Its initial seven-configuration pilot is retained, but is not an isolated collective speedup. With views and exact group widths fixed, generated Metal differs only in the two closed sum/max phases. Across three decode shapes and 64/1024-thread controls, descriptive GPU batch changes are only about 2.5–8.5%; the remaining native/Torch ratios are 6.95–17.34×.
A benchmark-only probe expresses QK using existing
reduce(query * key, d, add) and keeps PV as mma. It changes the QK
contribution-axis distribution without introducing a DSL primitive or
production operator-name rule. The compiler and cost model are unchanged.
B,Hq,Hkv,Q,K,D,Dv |
QK mma / 1024 |
QK reduce / 64 |
QK reduce / 1024 |
Reduce-1024 / Torch |
|---|---|---|---|---|
1,8,2,1,2048,64,64 |
492.850 |
718.674 |
363.985 |
9.245× |
1,8,2,1,2053,80,96 |
958.355 |
1535.067* |
519.987 |
3.798× |
1,16,4,1,4096,128,128 |
1328.624 |
1924.518 |
730.416 |
9.640× |
Both forms use explicit input views and enabled closed collectives. Four
rounds balance native/Torch order within each configuration, not between
configurations; cross-column differences are descriptive, not paired A/B.
* All four native rounds pass, but one Torch counter sample fails its timing
validation; no complete native/Torch ratio is published for that case.
The final column is a median of same-round ratios for the complete 1024-thread
cohort, not a ratio of cross-cohort medians. Timings include command-buffer
gaps; separately retained compute-pass probes are instrumented, not pure
hardware kernel events. Torch uses functional SDPA with output/internal
allocation inside timing and an explicit precomputed bottom-right causal mask.
At 64 threads, one full subgroup per QK output requires 16 batches for the 32-output tile; at 1024 it needs one. The probe therefore regresses at 64 and improves at 1024. This supports searching output/contribution partition factors and phase transitions together; it does not justify mechanically turning every contraction into a full-subgroup reduction. Small-M contractions still miss the 8×8 matrix atom, and composed reference planning does not yet account for their serial contribution work. A general typed-contraction candidate, interleaved replay and held-out cost validation are next steps.
The Chinese study and limitations
and independent raw-sample audit
retain 172 rows: 171 valid and one timing failure, all 86 native full-output
FP64/guard checks, generated sources, six timing views and six rejected
adversarial audit mutations. No MPS/Torch parity claim follows from this probe;
direct XIR/SIMD performance is unchanged.
Multi-output pointwise fusion removes a mapping boundary
The September 6 pointwise graph extension admits several independent output domains sharing compiler-owned SSA. It removes the previous program-per-worker fallback without matching operator names or shapes. This is a new legal realization, not new cost coefficients or a fitted solver. The existing 1×256 element block and automatic 256-thread policy are frozen throughout this comparison.
Both graphs return an activation and its derivative, in two distinct native output buffers. GELU uses the tanh approximation. Torch preallocates both outputs and uses three eager out operations for sigmoid, two forward/backward out operations for GELU. It is not compiled fused Torch or a full training step. Six fresh-JIT rounds balance mapper and framework order independently, at 9 samples, 30 ms sample windows and 100 ms warmup. All 192 complete value/derivative pairs (384 output planes) pass FP64 validation; 23 fingerprinted artifacts remain unchanged. The disabled-fusion reference matches the old compiler’s Metal source on all eight cases.
The table uses no-counter GPU command-buffer batch intervals in µs/op, including work and gaps inside those buffers, not isolated kernel time. Old/new and new/Torch are medians of paired round ratios; lower new/Torch is better. The large cases improve too, but much less than the tiny underfilled reference launches.
Graph / rows×width |
Reference GPU µs |
Fused GPU µs |
Torch GPU µs |
Old/new |
New/Torch |
|---|---|---|---|---|---|
sigmoid / 1×127 |
96.588 |
2.018 |
6.523 |
48.138× |
0.309× |
sigmoid / 37×1537 |
252.647 |
3.546 |
9.803 |
71.257× |
0.362× |
sigmoid / 1024×4096 |
366.747 |
105.319 |
288.584 |
3.503× |
0.365× |
sigmoid / 4096×4096 |
1566.623 |
679.060 |
1712.971 |
2.298× |
0.399× |
GELU / 1×127 |
124.775 |
3.016 |
4.414 |
41.279× |
0.684× |
GELU / 37×1537 |
279.678 |
6.468 |
6.793 |
43.277× |
0.952× |
GELU / 1024×4096 |
451.546 |
105.544 |
197.518 |
4.232× |
0.530× |
GELU / 4096×4096 |
2045.484 |
677.876 |
1227.067 |
3.025× |
0.556× |
All 48 new/reference pairs improve in both batched GPU and E2E time. Paired E2E speedups are 29.70–50.22× for the two smaller shapes and 2.36–3.68× for the larger ones. All eight median GPU and E2E comparisons favor the fused Tile kernel over eager Torch, but not every round or latency objective wins: small GELU loses one of six GPU batch pairs to Torch, and 37×1537 GELU’s single-call E2E ratio is 1.024×, losing three rounds. Its GPU batch margin is only about 5%. Desktop activity is not isolated, ranges are not confidence intervals, and separately instrumented compute-pass samples remain diagnostics.
The frozen replay
retains all four timing views. The
audit and limitations
link raw samples, generated sources, complete-output checks and adversarial
audit tests. Single-output Add/GELU and Softmax/RMSNorm/LayerNorm controls
have identical old/new Metal source. CPU controls differ only in bijectively
renamed TBAA object-address labels; no CPU speedup follows from this change.
Attention, CNN/filter and sort/Top-K regressions pass correctness checks, not
a new optimized-performance comparison. Register-heavy multi-output graphs,
general affine output layouts, fusion partitioning and cross-device
profitability remain open; this result does not close the MPS/GEMM or
direct-XIR/SIMD gaps.
Partitioned outputs remove the RoPE mapping fallback
The September 7 common-LLM benchmark exposes a remaining admission boundary: two output loops writing disjoint regions of the same buffer were rejected by pointwise fusion. Split-half RoPE consequently ran one entire row per worker, with four half-row private arrays. The general address-range proof now admits separated regions using independent local-coordinate tuples. It does not recognize RoPE, change its capture, fit costs, or add a DSL op. Overlapping writes and unknown separation retain the reference realization.
Six rounds cover every ordering of a frozen pre-change compiler, the candidate and eager Torch; five samples use 20 ms windows and 100 ms warmup. All 144 complete outputs pass FP64 checks across four RoPE and four SwiGLU shapes. Native outputs additionally have two complete C++ oracle/guard checks. These are FP32, supplied split-half sine/cosine tables, no autograd, and device- resident inputs. Torch RoPE uses six preallocated eager out operations, not a compiled/fused model kernel. CPU/SIMD is not improved by this TIRx change.
Rows×width |
Old Tile |
New Tile |
Torch |
New/old, paired |
New/Torch, paired |
|---|---|---|---|---|---|
1×128 |
18.336 |
2.277 |
13.348 |
0.1231× |
0.1578× |
37×1538 |
1385.836 |
5.212 |
39.913 |
0.00375× |
0.1290× |
1024×4096 |
2332.648 |
104.867 |
363.436 |
0.04467× |
0.2899× |
4096×4096 |
9466.156 |
570.646 |
1782.299 |
0.06084× |
0.3191× |
Every RoPE GPU/E2E batch pair improves against both references. The enormous small/ragged old/new ratio repairs an underfilled, whole-row realization; it is not a claim that RoPE mathematics became hundreds of times cheaper. Large shapes also improve. Single-call E2E new/Torch median ratios are 0.851, 0.746, 0.581 and 0.395, with one slower 37×1538 round. GPU controls include command- buffer work and gaps; they are not isolated kernel timers.
SwiGLU is a single-output control: all four old/new Metal sources are byte-
identical. Its measured GPU new/Torch ratios are 0.553, 0.536, 0.486 and 0.593
for 1×127, 37×1537, 1024×4096 and 4096×4096, respectively. Torch uses
preallocated aten.silu.out followed by mul.out. This is existing fusion
performance, not a gain from this patch. Tiny SwiGLU loses four of six
single-call E2E pairs, and 1024×4096 loses one. An earlier two-round screen
also reversed the small 37×1537 GPU result; desktop microsecond-scale results
remain sensitive to run conditions, not population confidence intervals.
The LLM evidence and limitations
retain all timing views, source identities, unsuccessful attention/SIMD
measurements and the independent audit. This checkpoint does not establish
general attention, MPSGraph, low-precision or direct-SIMD parity.
Attention and direct SIMD still need richer execution mappings
This is the retained pre-cooperative negative screen. The subsequent six-order replay removes the Metal worker fallback but still loses to Torch; SIMD is unchanged.
The same shared captures also expose negative performance results. Two- order, three-sample Metal pilots use the default backend planner, with fixed attention blocks selected before timing. Full FP64 output validation passes, but no cooperative group plan is selected: the prefill launch has only 32 workers, decode eight, each retaining whole-program private Tiles and scalar MMA/reduction loops. The sources contain neither cooperative matrix nor subgroup reduction calls. This establishes a missing realization family, not a small scheduling-coefficient error or a measured decomposition of every cycle. These pilots are not an exhaustive search for the best legal block.
B,Hq,Hkv,Q,K,D,Dv |
Query×key block |
Tile µs |
Torch SDPA µs |
Tile/Torch, paired |
|---|---|---|---|---|
1,4,2,64,128,64,64 |
8×16 |
6322.927 |
49.913 |
126.690× |
1,8,2,1,2048,64,64 |
1×32 |
48361.646 |
36.770 |
1315.769× |
Torch uses functional SDPA with an explicit bottom-right-aligned causal mask, GQA enabled, and output allocation included. The Tile programs use an online softmax recurrence and noalias output. This is neither a KV-paging benchmark nor end-to-end model inference. A tiny 24-element attention output won an earlier screen; it plainly did not predict these larger results.
Direct XIR/SIMD also remains slower. The following independent two-order screen uses eight requested CPU workers and packet width eight. Times are warm E2E, not GPU timings or isolated CPU kernel times. All 24 native/Torch outputs pass; every native/Torch batch pair loses.
Operator / rows×width |
XIR/SIMD µs |
Torch CPU µs |
XIR/Torch, paired |
|---|---|---|---|
SwiGLU / 1024×256 |
411.271 |
172.352 |
2.385× |
RoPE / 1024×256 |
323.266 |
265.211 |
1.219× |
RMSNorm / 64×256 |
226.631 |
13.859 |
16.352× |
LayerNorm / 64×256 |
399.877 |
47.398 |
8.437× |
GELU+residual / 64×256 |
120.551 |
74.129 |
1.626× |
Masked softmax / 64×256 |
258.099 |
64.340 |
4.017× |
SwiGLU/RoPE preallocate all Torch outputs; the other four use functional
expressions with temporary/output allocation included. These are direct
XIR results, not TIRx→Accelerate results. A separate decode case
(1,4,2,1,128,64,64) failed to finish two native attempts within 90 s before
source export; both failures remain in the matrix, alongside Torch timings.
Static expansion of whole Tiles and mapping packets across programs remain
visible structural limits; this experiment does not isolate their individual
runtime cost from dispatch, vector math and scheduling overhead.
Next work must add legal composed MMA/reduction recurrences on Metal and
bounded, contiguous Tile-element distribution on XIR before fitting their
costs. Singleton/batch axes, online loop carries and storage ownership must
survive those transformations. A per-operator name table or smaller test
dimensions would not establish that capability. Raw samples, generated
sources, compiler hashes and timeout records are in the
LLM evidence.
Automatic cooperation removes the attention worker fallback
The next TIRx-to-Metal change admits a composed parallel program into the existing cooperative mapper, projects singleton matrix axes and budgets pipeline versions against the possible group’s storage. It trusts the primitive independence contract; representation, effect and resource checks remain. There is no kernel-name dispatch. This is candidate-space and capacity repair, not a newly calibrated joint solver.
Six balanced native/old-binary/Torch orders, five samples and the same fixed attention blocks give the following FP32 M1 Max results. “GPU” is the no-counter command-buffer control, not isolated kernel time.
B,Hq,Hkv,Q,K,D,Dv |
Block |
Old GPU µs |
New GPU µs |
Torch GPU µs |
Paired new/Torch |
Paired new/old |
|---|---|---|---|---|---|---|
1,4,2,64,128,64,64 |
8×16 |
7263.604 |
80.612 |
27.876 |
2.894× |
0.011113× |
1,8,2,1,2048,64,64 |
1×32 |
47977.771 |
327.875 |
32.348 |
10.132× |
0.006830× |
All twelve GPU/E2E batch pairs improve over the old realization; all twelve still lose to Torch SDPA. New/Torch GPU ranges are 2.832–2.992 and 4.974–10.564. E2E batch times are 100.087/335.382 µs versus Torch’s 52.877/42.579 µs, paired ratios 1.885/7.867. Single-call E2E gives paired ratios 0.899/1.922, with prefill losing one round; it is a separate objective. All 36 complete native/old/Torch outputs pass independent FP64 validation. Torch includes returned-output allocation and uses functional masked GQA SDPA, whereas native uses preallocated output and online softmax.
Prefill selects 64 threads/group and tensorizes the first contraction; the expression-initialized second contraction remains scalar. Decode selects 1024 threads/group but cannot use an 8×8 atom at query extent one. Both still have shared materializations, barriers and scalar reduction loops. This is source evidence, not a measured cycle breakdown or an optimal geometry claim. Native MPP and direct XIR/SIMD are unchanged.
Counter-instrumented compute medians are 97.985/331.515 µs for new Tile and
66.981/41.118 µs for Torch, retained only as diagnostics: Torch’s
counter/control ratios are 3.932/1.759. The observer is not neutral. Raw
samples, generated sources, frozen-binary fingerprints, reproduction and the
five negative audit checks are in the
cooperative-program evidence.
Both binaries include the same unrelated, uncommitted barrier-flag edit;
these are worktree-artifact measurements, not clean-checkout source identity.
Metal subgroup reductions close the measured normalization defect
The lowering reference
documents the new opt-in TIRx Metal realization. It structurally revalidates
canonical FP32 add/max/min reductions, searches whole-SIMD-group cooperating
widths, and derives private/shared storage from the selected execution
map. For softmax width 4096, a logical compiler-owned 4096-element Tile becomes
a compact private stripe (16 values at 256 threads) only after every access proves the same affine
owner; the old per-thread float[4096] form is rejected by source tests.
The two original current-binary cohorts use 11 samples, 100 ms calibrated sample windows and 100 ms warmup. All 20 complete FP64 checks pass:
Family |
Shapes |
Tile/Torch range |
Fastest absolute Tile |
Slowest relative Tile |
|---|---|---|---|---|
row sum |
1×127, 17×257, 128×1024, 64×4096 |
0.293×–0.716× |
3.106 µs |
0.716× |
softmax |
same widths/row counts |
0.124×–0.286× |
3.305 µs |
0.286× |
RMSNorm |
same widths/row counts |
0.546×–0.902× |
3.904 µs |
0.902× |
LayerNorm |
same widths/row counts |
0.511×–0.648× |
4.500 µs |
0.648× |
cross-entropy |
same widths/row counts |
0.032×–0.052× |
3.449 µs |
0.052× |
The four additional residual-LayerNorm cases search both shared-Tile policies
with separate capture/JIT/full validation, then recapture the winner. Metal
selects PRESERVE in every case:
Rows×width |
Tile µs |
eager Torch MPS µs |
Tile/Torch |
Worker stripe scalars |
|---|---|---|---|---|
1×127 |
3.426 |
10.671 |
0.321× |
4 |
17×257 |
3.655 |
11.705 |
0.312× |
6 |
128×1024 |
6.321 |
18.592 |
0.340× |
8 |
64×4096 |
8.324 |
27.046 |
0.308× |
32 |
The independent same-binary replays rotate variant and case order for four
rounds. The subgroup path is 21.19×–49.87× faster for RMSNorm and
14.04×–75.54× for LayerNorm/cross-entropy by median paired ratio. Native uses
preallocated output; PyTorch’s functional normalization/loss calls allocate
their returned output inside timing, so only the native reference/candidate
A/B is the clean causal comparison. The saved
cohort report,
balanced replay,
row extension
and
extension replay
and the
residual materialization search
retain every sample, plan, output error, artifact hash and exact command. The
separate
materialization A/B
isolates the Metal decision: median paired preservation speedup is 1.057×,
1.008×, 1.354× and 1.421× from smallest to largest shape. The analytic v1
model does not count duplicated global loads or expression depth and incurs up
to 43.66% regret; the report preserves that miss rather than calling it a
model success.
This closes the diagnosed scalar-worker realization for the admitted subset. It is not production attention, training-loss/backward coverage, low-precision evidence, held-out device calibration or pure Metal kernel timing. In particular, the very large cross-entropy advantage includes PyTorch’s general eager API and returned-output overhead; it is not presented as an isolated MPS-kernel ratio.
Initial XIR/SIMD planner pilot
The XIR pilot
compares automatic planning, fixed {order=[0,1], block=64}, and eager
Torch on the same CPU, separately from TIRx. The Tile specialization is fixed
at 1×1×8. Six rounds balance all three implementation orders for 32³, 128³
and 127×193×61. Raw outputs, LLVM source, actual plans and hashes are retained.
This pilot asks whether the initial mapping prior helps that specific specialization; it is not a production GEMM schedule search or a benchmark of the LLM family. The report preserves negative results and names the exact comparison baseline. Neither a better model score nor a passing test is reported as a speedup.
Shape |
Planned µs |
Fixed map µs |
Torch µs |
Paired planned/fixed |
Paired planned/Torch |
|---|---|---|---|---|---|
32³ |
50.822 |
50.037 |
0.978 |
1.0157× |
51.851× |
128³ |
272.410 |
278.352 |
4.979 |
0.9755× |
54.543× |
127×193×61 |
255.711 |
281.315 |
6.696 |
0.9142× |
38.186× |
All automatic plans chose root order [0,1]; worker packing differed from the
fixed 64-worker control. Automatic planning was slower in 4/6, 3/6 and 1/6
rounds respectively. The fixed comparison therefore shows a modest, noisy
mapping effect, while the 38–55× Torch gap diagnoses a missing realization
family. This is direct evidence for Tile/lane distribution, register blocking,
cache-aware reuse and vector/matrix microkernels before cost-model polishing.
SIMD packet-index proof closes a codegen disconnect
The September 6 bounded packet proof lets Schedule retain value-preserving integer casts and prove aligned quotient/remainder relationships. The existing memory emitter now uses eight A broadcasts and eight contiguous B reads per static 1×1×8 K chunk, instead of sixteen gathers. The Tile program, root plan, cost coefficients and strict math policy are unchanged. This is an index-analysis/codegen change, not a new GEMM DSL primitive or a BLAS substitution.
The final six-round frozen old/new/Torch comparison validates all 108 full outputs and 38 unchanged artifacts. Values below are synchronized host-wall batched dispatch microseconds; they are not CPU kernel-only timings.
M×N×K |
Old µs |
New µs |
Torch µs |
Paired new/old |
New slower rounds |
New/Torch |
|---|---|---|---|---|---|---|
32³ |
51.739 |
38.913 |
0.978 |
0.756 |
0/6 |
39.986 |
128³ |
301.521 |
118.771 |
4.936 |
0.398 |
0/6 |
24.215 |
512³ |
12528.875 |
4142.333 |
146.611 |
0.326 |
0/6 |
28.267 |
1024³ |
109013.021 |
39793.646 |
985.279 |
0.367 |
0/6 |
40.493 |
128×2048×512 |
13117.948 |
5592.222 |
158.803 |
0.427 |
0/6 |
35.075 |
127×193×61 |
246.743 |
247.816 |
6.549 |
1.006 |
5/6 |
38.045 |
The four nontrivial aligned shapes improve in every throughput and single-call
latency pair; small-shape latency is mixed. The ragged control has identical
LLVM in both arms and retains its small throughput regression and mixed
latency, rather than being dropped. The
complete report
keeps both metrics, observed ranges, compile times, the earlier replay and
source/binary boundaries. These gains are relative to the old implementation:
every final shape still loses to Torch, with aligned nontrivial throughput
ratios of 24.2–40.5. Cache/register blocking and local-Tile/lane distribution
remain the larger CPU realization gap. Multi-operator correctness tests pass;
this cohort makes no new LLM-operator performance claim.
A separate new 8192³ MPS capture passes complete FP64 validation. Xcode window inspection timed out, so its launch/counter attribution is not available yet; the capture is excluded from performance rankings. No Metal default changes follow from this CPU checkpoint.
Balanced Metal evidence: MPP cost v2 closes this GEMM cohort
The cost-model study
first preserves the failed v1 ranking. Across the same 8 shapes and 45 requested
block/thread candidates, v1’s mean/median/maximum finite-set regret is
74.18/43.05/239.58%; v2’s is 8.82/2.59/34.37%. Exact measured-winner picks
increase from 1/8 to 4/8. Those 3-sample, 10 ms values are in-cohort and
diagnostic. They neither establish held-out prediction nor replace final timing.
The independent v2 replay
freezes the measured schedules, then uses 14 balanced rounds, 8 shapes and
7 compiler/library paths. All 784 complete outputs passed the same FP64 oracle;
all 21 fingerprinted benchmark/compiler/runtime artifacts retained their hashes.
No schedule was searched or selected during replay.
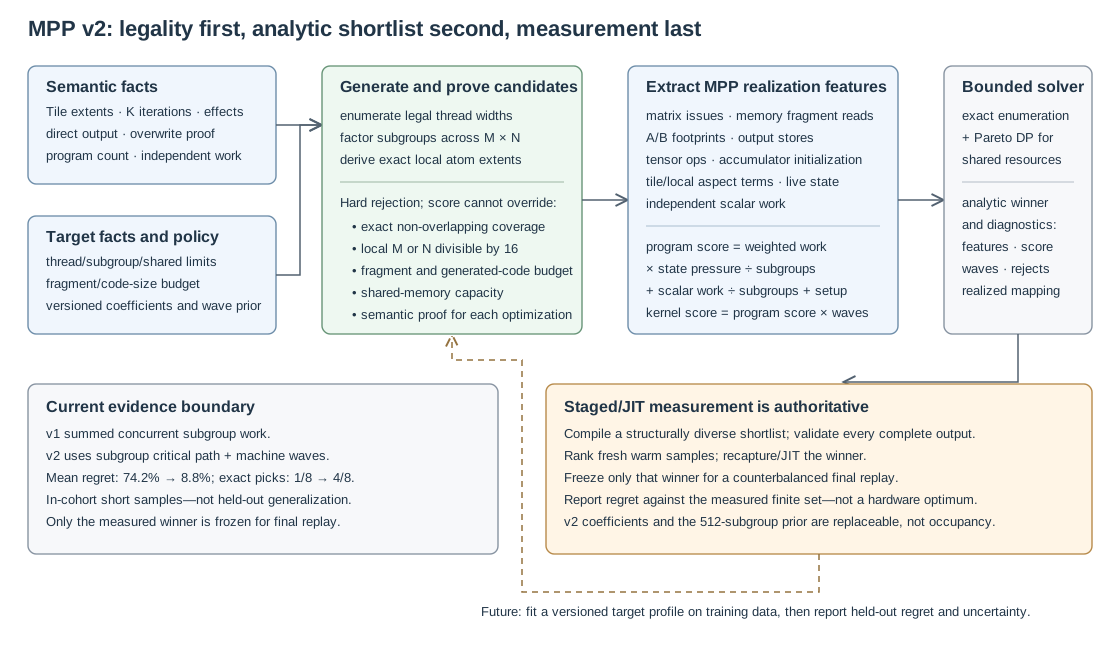
The analytic plan is a shortlist prior. The independently validated measured winner is what the replay freezes.
Shape |
Frozen block @ threads |
TIRx MPP views |
Hand MPP |
MPS |
Torch |
Paired view/MPS |
Paired view/Torch |
|---|---|---|---|---|---|---|---|
32³ |
32×32×32 @ 128t |
2.982 |
2.809 |
10.081 |
26.899 |
0.2794× |
0.1105× |
128³ |
32×32×128 @ 256t |
5.335 |
5.441 |
16.904 |
27.218 |
0.3174× |
0.1943× |
512³ |
32×64×32 @ 128t |
42.413 |
46.802 |
52.428 |
47.745 |
0.8285× |
0.8919× |
1024³ |
128×32×1024 @ 128t |
270.675 |
266.105 |
272.572 |
284.654 |
0.9938× |
0.9513× |
256×1024×128 |
64×64×128 @ 256t |
16.025 |
17.286 |
20.350 |
28.668 |
0.8189× |
0.5554× |
1024×128×256 |
32×32×32 @ 128t |
16.500 |
18.508 |
26.270 |
28.655 |
0.5946× |
0.5596× |
127×193×61 |
32×32×32 @ 256t |
8.861 |
7.127 |
16.915 |
26.997 |
0.5172× |
0.3266× |
513×257×129 |
32×32×32 @ 256t |
20.607 |
24.424 |
35.043 |
34.002 |
0.5874× |
0.6057× |
At 1024³ the new 128×32×1024, 4×1-subgroup schedule is 4.87% faster than Torch, 5.76% faster than native Tile→MPP and 0.62% faster than MPS by paired ratio; it remains 1.68% slower than handwritten MPP. It was slower than MPS in only 1/14 rounds. Across all eight rows the TIRx-view path beats both external baselines. This closes the measured FP32 GEMM cohort, not the general library- performance goal: model v2 still needs held-out shapes/operators and residual regret shows that cache/layout, edge and launch features are incomplete.
Native/handwritten MPP use fast math off; TVM’s Metal runtime uses fast math on. All values above are synchronized host-wall batched times, not GPU-event durations. The original TIRx, staged TIRx MPP, native MPP, handwritten MPP, MPS and Torch controls remain in the raw report.
Larger matrices: the 1024-cubed win does not generalize
The new six-shape scale test freezes existing schedules before timing; it
does not tune a new winner at each size. Native and handwritten MPP retain
their old 32×32 control; ordinary and non-forwarding TIRx use 32×32×32,
128 threads. The view path transfers the old 128×32×1024, 128-thread winner
unchanged. Fourteen rounds balance all seven positions and pair precedence.
The predeclared protocol
and complete scale report
retain all paths, round ranges, single-call timings and failures.
8192³ still has a substantial gap. Native MPP’s paired GPU/Torch time ratio is 1.985 [1.916, 2.786], slower in all 14 rounds. TIRx→MPP views reduces that to 1.125 [1.019, 1.251], but also loses all 14 GPU pairs. Its E2E/Torch ratio is 1.096 [0.887, 1.597], with only two faster rounds. This is not general MPS/Torch parity; the nearby 2048³/4096³ medians have much wider mixed ranges.
GPU batch times below are milliseconds, from no-counter command-buffer intervals, not isolated kernel timestamps. Native/handwritten MPP keep fast math off; TVM Metal’s existing fast-math behavior is unchanged. “TIRx” means ordinary SIMD-group matrices, “MPP” means TIRx→MPP without forwarded inputs, and “Views” means TIRx→MPP with proved input views. MPS is the direct matrix API, not MPSGraph; Torch is eager MPS. All outputs are preallocated for GEMM.
M×N×K |
Native |
TIRx |
Hand MPP |
MPS |
Torch |
MPP |
Views |
|---|---|---|---|---|---|---|---|
2048×2048×2048 |
3.201 |
4.089 |
2.832 |
3.018 |
2.989 |
3.713 |
3.012 |
4096×4096×4096 |
29.978 |
39.556 |
27.169 |
30.148 |
27.074 |
33.065 |
29.273 |
8192×8192×8192 |
476.117 |
438.198 |
412.663 |
248.050 |
237.612 |
421.804 |
271.092 |
256×11008×4096 |
6.581 |
6.128 |
6.902 |
3.944 |
3.810 |
5.718 |
4.264 |
4096×4096×11008 |
102.115 |
156.372 |
90.646 |
94.582 |
82.550 |
150.774 |
rejected |
2049×4097×1025 |
3.626 |
10.898 |
3.748 |
3.645 |
3.350 |
10.581 |
rejected |
Separately measured batched E2E milliseconds, including warm Runtime/ framework dispatch, submission and synchronization:
M×N×K |
Native |
TIRx |
Hand MPP |
MPS |
Torch |
MPP |
Views |
|---|---|---|---|---|---|---|---|
2048×2048×2048 |
3.254 |
4.208 |
2.883 |
3.012 |
3.196 |
3.596 |
3.144 |
4096×4096×4096 |
30.026 |
35.439 |
27.701 |
30.651 |
27.377 |
32.446 |
29.808 |
8192×8192×8192 |
461.686 |
369.682 |
412.923 |
295.217 |
278.915 |
399.020 |
300.684 |
256×11008×4096 |
6.529 |
6.214 |
7.156 |
4.101 |
3.896 |
6.005 |
4.276 |
4096×4096×11008 |
95.074 |
146.511 |
91.488 |
85.497 |
77.179 |
131.272 |
rejected |
2049×4097×1025 |
3.984 |
11.906 |
3.865 |
3.811 |
3.520 |
11.755 |
rejected |
GPU and host phases are independent; do not subtract these medians to infer dispatch cost. Large GEMM times drift substantially despite balanced order; the experiment does not identify the cause. No noisy labels refit the model.
The two rejected view requests have K tails. MPP’s unguarded address contract
prevents forwarding a region that is not proved fully in bounds; materializing
the fixed large tiles then fails the bounded resource/geometry planner.
This is a fixed-schedule admission failure, not general MPP unavailability:
the other six paths validate both shapes. At that checkpoint, bounded full/tail
realization and shape-aware resource search remained open; no substitute block
hid the rejection. The later bounded-K result below does not rewrite those
historical failures. The loader preflight
also preserves the initial unpatched-TVM capability failures separately.
All 560 executed GEMM replay outputs pass complete FP64 comparison; 28 view
admission failures remain failures. All 26 inventoried artifacts are unchanged.
The independent audit and all paired metrics
checks recorded validation, balanced order, fixed plans, sources and all four
timing metrics. These deterministic FP32 tests are not low-precision or
end-to-end model coverage. The separate
wide-row reduction cohort
extends normalization to width 16384 and a 512 MiB input/output payload.
Bounded-K MPP views: legal tails, remaining library gap
The September 6 bounded-K proof admits a common zero-padded K suffix as two immutable physical input views. The previously fixed 128×32×1024 schedule now needs zero shared allocation in these cases, instead of nominal 640 KiB A/B staging. The frozen old v2 binary rejects the three K-tail requests; there is no old execution time to divide by. M/N tails, extra masks, nonzero fill and unequal A/B K intervals remain outside this forwarding capability. No model coefficients or DSL entities change.
The fixed four-shape, seven-route, 14-order replay validates 392/392 full outputs (8,325,201,920 checked elements) and 26 unchanged artifacts. The small shape wins all host-throughput pairs against MPS/Torch, but has mixed GPU pairs against MPS. Every nontrivial shape still has a paired GPU time ratio above one against both libraries. This is not general library parity.
M×N×K |
TIRx MPP views µs |
MPS µs |
Torch µs |
Paired view/MPS |
Paired view/Torch |
|---|---|---|---|---|---|
128×128×61 |
8.592 |
8.938 |
13.889 |
0.962 |
0.658 |
1024×1024×1537 |
511.423 |
433.547 |
437.150 |
1.180 |
1.171 |
4096×4096×11008 |
60221.083 |
53208.125 |
54887.771 |
1.097 |
1.124 |
8192³ |
241151.958 |
220077.896 |
210055.750 |
1.075 |
1.182 |
Views lose 5/14, 14/14, 10/14 and 8/14 GPU-throughput pairs to MPS, and 0/14, 14/14, 12/14 and 12/14 to Torch, respectively. At 8192³ the generated view source is identical to the earlier scale cohort. Its current 192.820–285.891 ms range and cross-session differences are not a compiler speedup or evidence of a particular thermal/cache cause.
Separate batched E2E view times are 8.845, 521.213, 57790.291 and 193842.396 µs. Paired view/MPS ratios are 0.889/1.169/1.119/1.204; view/Torch ratios are 0.302/1.141/1.141/1.161. Single-call latency remains separate and retains regressions. The no-counter GPU interval includes command-buffer work/gaps, not isolated shader instruction time; instrumented compute-pass samples remain diagnostic.
Against the retained materialized 32×32×32 TIRx MPP control, paired GPU ratios are 0.677/0.439/0.739/0.776, all 14 pairs improving at every shape. This comparison includes both view realization and different geometry; it is not a same-schedule ablation of the new proof. The large K-tail case still has one host-throughput regression against that control.
The complete seven-route report
and independent audit
retain every path, all four metrics, ranges, orders, source hashes and old
admission failures. A separate 36-output
operation-scope screen
finds no universally better collective width; no single-order minimum becomes
a default. M/N-edge atoms, physical K chunking, reuse and distribution remain
the next realization work, followed by independent model/search validation.
Bounded M/N inputs remove an admission barrier
The next September 6 checkpoint extends bounded M/N input views. Ragged matrices can now use large K blocks without nominal A/B staging. After staged/JIT selection, GPU batch time falls to 22%, 19–21% and 15% of the old path on the three larger ragged shapes below. This includes newly legal schedules, not just a same-schedule compiler improvement. General MPS/Torch parity is still not achieved.
Both compilers receive BM=128, BN=32, BK=16/1024/4096, 128 threads, window=1 and copy batch=1. The frozen old compiler rejects the two large-BK requests on each ragged shape and selects BK=16. The new compiler selects BK=4096, except the reverse 4097×4097×4096 run selects BK=1024. A/B denote forward and reverse orders in an old/new/new/old replay. Each number below is a fresh post-selection median of five samples, not the tuning minimum.
M×N×K |
Old TIRx views µs |
New TIRx views µs |
New/MPS time |
New/Torch time |
|---|---|---|---|---|
129×257×61 |
31.995 / 31.236 |
24.576 / 24.854 |
1.675 / 1.684 |
1.388 / 1.561 |
1025×1025×1024 |
2122.583 / 2156.722 |
470.910 / 467.192 |
0.972 / 0.961 |
1.221 / 1.213 |
2049×4097×1025 |
15136.375 / 15928.875 |
3121.892 / 3102.326 |
1.125 / 1.126 |
1.208 / 1.198 |
4097×4097×4096 |
140672.250 / 140243.292 |
21216.667 / 21629.167 |
0.969 / 0.980 |
1.070 / 1.061 |
1024³ control |
282.365 / 278.570 |
278.889 / 281.747 |
0.990 / 1.004 |
0.972 / 0.979 |
The new path narrowly beats MPS in GPU batch time on two ragged shapes, but still loses to Torch on all four. The small case beats Torch in E2E batch time (0.857/0.862×), while losing its GPU comparison: dispatch savings are not a pure-kernel win. At 4097×4097×4096, E2E batch time is 21.841/22.423 ms; new/MPS ratios are 0.942/1.005 and new/Torch 1.078/1.095. Single-call GPU and E2E latency remain separate in the audit and retain regressions. GPU command-buffer controls include work/gaps; instrumented compute-pass times are diagnostic, not unperturbed isolated-kernel rankings.
At the same BK=16, new/old GPU ratios are 0.669–0.679, 0.760–0.775 and 0.388–0.403 on the three larger ragged shapes. But the small case regresses to 1.692–1.732×. The current nominal-work model does not price that edge handling well, so no new cost coefficients or default schedule are promoted. The aligned 1024³ sources are identical for all three blocks; its timing variation is not a compiler speedup. Ragged programs still materialize a 16 KiB output tile and retain four barrier sites. Masked direct output and physical-K/edge-aware planning remain structural work.
Two earlier, numerically correct emitters regressed much more severely: per-output empty-operand scans, then per-column collective scans. Their full ABBA runs and patches are retained. The final emitter gives lanes ownership of input rows/columns, shuffles the nonfinite/sign classification to output coordinates, and keeps a static-M/N interior path. Across the three emitter runs, 576 complete outputs pass FP64 comparison; each run retains 16 old resource rejections and 35 unchanged artifacts. The final run alone checks 995,833,488 elements. Desktop activity was not isolated, and two orders are not a held-out performance acceptance test.
The checkpoint notes and reproducible commands
and independent audit, all four metrics and controls
preserve every candidate, failure, source and comparison. The semantic suite
also checks 1,008 full low-level outputs with non-dyadic inputs, transposes,
empty/partial M/N, Inf/NaN, signed zero and distinct C/D. This checkpoint does
not change native-MPP or SIMD performance, other operators, or broader dtype
coverage.
MPP state budget and candidate admission
The realization-state correction removes a second structural search restriction: MPP candidates no longer pay the SIMD-group emitter’s nonexistent A/B fragment allocations. The default 64-scalar budget and all cost coefficients are unchanged. Explicit MPP budgets now also admit the legal four-scalar 8x16 minimum; reference A/B/C accounting and physical shared-memory checks remain intact.
The fixed exploratory set contains four output blocks times three thread counts, with BK=4096 and pipeline window 1. On each of 1024³, 4096³, 1025×1025×1024 and 4096×4096×11008, valid candidates increase from 6/12 to 10/12. The full-output audit covers 64 accepted trials and eight freshly compiled selections: 216 complete native/Torch/direct-MPS outputs, about 1.93 billion checked elements. All 24 old/new common candidate sources are byte-identical. The remaining rejections exceed the explicit-state budget.
There is no accepted speedup or new calibrated/default schedule in this
checkpoint. Search timings were unstable during concurrent desktop activity;
all eight selected configurations became 1.23–1.88× slower on fresh GPU
measurement than their selected trial. Selection bias and changing load are
not separated by this exploratory run. Those numbers diagnose why its minima
cannot establish a performance gain; they do not measure an old/new compiler
regression. Raw GPU command-buffer and E2E batch/single results remain in the
source-backed audit and methods.
Final correctness checks cover 4,992 independently enumerated admission
combinations, 42 newly admitted Metal programs (including staged/global views,
transposes, ragged bounds, minimum/exact budgets and nonzero recurrence state),
CPU/Metal execution and operator regressions, and native Metal Runtime. The
final receipt
keeps failures against the old library as explicit negative controls.
At that checkpoint, the planned held-out cohort and six-round frozen replay
had not run in a quiet window. The next correction addresses physical K and
eliminated scalar work; native MPP/SIMD gain no new performance claim.
Realization-derived work and model selection
The v3 matrix work model uses the bounded K expression actually emitted by MPP and excludes scalar loops only when the selected recurrence/direct-output realization removes them. Those costs enter the Pareto objective before pruning. It also prices the global fragment store replacing a scalar sink. No coefficient, budget, numerical permission or operator-name/shape dispatch rule is added.
The registered experiment uses eight shapes through 8192³, fifteen identical candidates per model, and four protocol-held-out shapes. Selection uses only model scores, not timings. All 240 trials and 16 freshly compiled selections pass full native/Torch/direct-MPS checks: 768 complete outputs. Among 120 fixed-block old/new pairs, 118 have identical mappings and identical Metal source; two are remapped. Thus this is primarily a correction to model ranking, not a faster emitter for an unchanged schedule.
The final model choices change on three shapes. Schedules below are shown as BM×BN×BK, threads:
M×N×K |
Previous model |
Realized-work model |
|---|---|---|
1025×1025×1024 |
32×64×512, 64 |
64×64×4096, 128 |
4096×4096×11008 |
128×64×512, 256 |
128×64×4096, 256 |
2049×4097×1025 |
64×64×128, 128 |
64×64×4096, 128 |
The other five selections retain byte-identical source. Frozen replay keeps both block and solved thread width, with six fresh-JIT rounds, all six native/Torch/MPS orders, counterbalanced old/new order, nine samples, 30 ms requested windows and 100 ms warmup. Its 288 complete outputs are checked separately from selection. GPU numbers use no-counter command-buffer intervals including work/gaps; E2E includes host dispatch and synchronization. Neither is an isolated kernel timestamp. Outputs are preallocated; existing TVM/Torch arithmetic policies are unchanged, not claimed identical.
M1 Max FP32 frozen replay: paired batch-time ratios, lower is better.
M×N×K |
GPU new/old (round range) |
GPU wins / 6 |
E2E new/old |
GPU new/Torch |
GPU new/MPS |
|---|---|---|---|---|---|
512³ † |
1.005 (0.995–1.015) |
2 |
1.003 |
1.166 |
0.966 |
4096³ † |
0.993 (0.988–1.008) |
5 |
1.004 |
1.270 |
1.162 |
1025×1025×1024 |
0.961 (0.944–0.970) |
6 |
0.945 |
1.097 |
0.867 |
4096×4096×11008 |
0.938 (0.929–0.949) |
6 |
0.949 |
1.286 |
1.202 |
257×769×113 † |
0.995 (0.938–1.013) |
4 |
0.990 |
1.371 |
1.273 |
2049×4097×1025 |
0.823 (0.809–0.839) |
6 |
0.816 |
1.150 |
1.052 |
4097×4097×4096 † |
0.998 (0.972–1.015) |
3 |
0.989 |
1.061 |
0.962 |
8192³ † |
1.002 (0.993–1.005) |
2 |
1.002 |
1.337 |
1.371 |
Ratios are medians of six paired batch-time ratios, not ratios of pooled minima or confidence intervals. † identifies byte-identical source controls, not compiler speedups. The three changed schedules win all six GPU pairs, with median GPU time reductions 3.88%, 6.16%, 17.75% and E2E reductions 5.53%, 5.06%, 18.39%, in the order of the mapping table. This supports a bounded model-selection improvement in this session. All eight candidate GPU medians remain slower than Torch. Only three MPS ratios are below one, two on unchanged-source controls, so MPS parity is not general either.
Concurrent desktop activity was observed. Same-source median GPU new/old ratios span 0.993–1.005, but individual pairs span 0.938–1.015. These controls and the consistent changed-schedule wins improve interpretability; they do not establish idle-machine causality, cross-device calibration or universal speedup. No timing-fitted coefficient or per-shape dispatch table is promoted.
The source-backed methods and limits
retain complete samples, source fingerprints, all round reversals, and the
separate GPU/E2E batch/single metrics. Same-source timing changes are controls,
not compiler speedups. This model correction does not establish universal
Torch/MPS parity; M/N edge fractions, cache traffic and opaque MPP state remain
unmodeled. Native Metal, XIR/SIMD and other operators do not inherit a new
speed claim. The full CPU/Metal matrix/execution/operator regressions pass;
28 new numerical matrix programs cover traversal direction, transposes,
partial bounds and realization choices, with four capacity rejections retained.
K partition and program walks: diagnostics, not new defaults
The earlier September 6 K-partition experiment fixes the TIRx MPP output block at 128×32, 128 threads and an ordered pipeline, changing only captured K across 128/512/1024/4096. All candidates retain the same four 32×32 subgroup outputs, zero shared allocation and persistent accumulator. 90 complete outputs pass the full FP64 check. This is staged/JIT schedule sensitivity, not a new compiler implementation or a balanced acceptance run.
M×N×K |
Order |
BK=128 |
BK=512 |
BK=1024 |
BK=4096 |
|---|---|---|---|---|---|
1024×1024×1537 |
A |
578.587 |
520.537 |
509.463 |
480.859 |
1024×1024×1537 |
B |
577.574 |
518.454 |
509.648 |
482.236 |
4096³ |
A |
22909.833 |
20572.708 |
19631.125 |
18230.583 |
4096³ |
B |
20507.875 |
20429.250 |
20369.542 |
18226.792 |
4096×4096×11008 |
A |
65308.458 |
56209.000 |
55701.750 |
56464.208 |
4096×4096×11008 |
B |
64176.000 |
56650.750 |
55364.333 |
56001.000 |
Orders A/B preserve both run-specific medians, not their minimum. BK=4096
improves on BK=1024 in the first two shapes; the long-K shape mildly reverses
that direction. Fresh recapture of the selected candidates is still slower
than MPS and Torch in all six GPU comparisons. The
complete K report and controls
keeps every MPS/Torch measurement, separate E2E/single-call metrics, stable
source/plan identities and the independent 11-artifact audit. No universal
K-size reward or new default is justified.
A separate hand-MPP probe adds a bounded program-grid permutation. It changes neither group count nor per-group work. Four/eight-row one-column stripes lose all ten paired GPU and E2E batch comparisons to linear traversal. At 8192³, GPU stripe4/linear is 1.551× / 1.544× and stripe8/linear is 1.828× / 1.813×. A follow-up using square output-region rectangles is inconclusive: at 4096³, rectangle2×8/linear reverses from 0.730× to 1.726×, while the MPS control also varies substantially. Keep these results out of performance acceptance and coefficient fitting until a stable replay.
The walk report
retains both complete 50-output screens, 144 development correctness outputs,
two additional unsigned-boundary outputs and all four metrics. The mapping
also passes 2,688 host bijection checks and four invalid/overflowing-request
checks. This remains a benchmark capability, not a production lowering
feature. TIRx already has a one-dimensional launch; improvements over the
hand probe’s legacy 2D launch must not be credited as a new TIRx speedup.
See the mapping boundary.
Whole-group MPP participation is not uniformly better
A later September 6 handwritten-MPP screen compares independent 32×32 subgroup operations with one collective operation at the same group output rectangle and thread count. It processes whole physical K, uses FP32 dynamic inline tensors and cooperative output, and disables fast math/relaxed precision. Direct MPS is a seventh arm; this screen has no TIRx or Torch arm.
The table is an exact matched-pair lookup. Values are collective/independent GPU batch-time ratios in forward / reversed order; below one favors collective participation. Each order uses five no-counter command-buffer samples, not isolated kernel timings or a confidence interval.
M×N×K |
128×64, 256 threads |
128×32, 128 threads |
64×64, 128 threads |
|---|---|---|---|
512³ |
1.018 / 1.135 |
0.995 / 1.043 |
1.016 / 1.054 |
4096³ |
1.046 / 1.116 |
1.114 / 1.094 |
1.121 / 1.124 |
8192³ |
1.143 / 1.115 |
0.827 / 0.854 |
1.017 / 1.006 |
256×11008×4096 |
0.972 / 1.032 |
1.020 / 1.049 |
0.858 / 0.907 |
2049×4097×1025 |
1.229 / 1.186 |
1.070 / 1.068 |
1.234 / 1.230 |
All 70 complete outputs pass, but 4096³ and the ragged matrix regress at
every matched geometry. The 8192³ collective 128×32 gain does not win the
whole candidate set: independent 128×64 is faster in both rounds, and still
behind MPS. Substantial control variation remains (512³ MPS: 49.232 versus
61.531 µs). There is no accepted speedup, calibrated participation rule or
production default change. The
methods and four-metric audit
retain every arm, output receipt, source, sample and order reversal.
Generic traversal composes with K, but is not a universal win
The September 7 TIRx traversal emitter adds an explicit coordinate permutation after local planning, with no operator-name rule or new cost coefficient. The exploratory screen fixes 128×64 group outputs, 256 threads and independent 32×32 MPP operations, crossing BK=512/4096 with row-major and 2×4/4×8/8×16 program rectangles. All 288 complete native/Torch/MPS outputs pass; 39 unique generated sources and unchanged artifact hashes are audited. Local matrix/resource plans stay identical for every fixed shape/BK comparison.
The table shows one fixed 4×8 candidate on all six shapes, not per-shape search winners. Each cell retains forward / reversed-order GPU batch-time ratios against the same-BK row-major control; below one favors traversal. Five samples per order use no-counter command-buffer GPU intervals. Both GPU/E2E batch/single results and all eight candidates remain in the audit.
M×N×K |
BK=512: traversal / row-major |
BK=4096: traversal / row-major |
BK=4096: traversal / Torch |
|---|---|---|---|
512³ † |
0.994 / 1.011 |
1.141 / 0.999 |
1.227 / 1.105 |
4096³ |
0.917 / 0.920 |
0.936 / 0.956 |
1.203 / 1.229 |
8192³ |
0.960 / 0.968 |
0.968 / 0.944 |
1.276 / 1.168 |
4096×4096×11008 |
0.948 / 0.969 |
0.973 / 0.961 |
1.235 / 1.220 |
2049×4097×1025 |
0.976 / 1.008 |
1.065 / 1.046 |
1.301 / 1.281 |
257×769×113 |
1.054 / 1.035 |
1.042 / 1.027 |
1.839 / 1.909 |
The three large regular grids favor this rectangle at both K sizes in both orders. The ragged and small cases do not generalize that result. † is a byte-identical-source control: the rectangle spans the entire eight-column program grid and simplifies to row-major, so its 14.1% apparent regression in one comparison is variation, not traversal cost. Other clamped identity candidates are explicitly labeled in the audit. No cache-miss/occupancy causality or stable timing acceptance is established by two rounds.
Every native/Torch GPU pair in the whole screen remains above one; MPS parity
is not established either. Default traversal and cost coefficients remain
unchanged. The next step is a frozen balanced replay, followed by a policy
that accounts for access-derived reuse and address work on held-out programs,
not a shape-name table. This enlarges the supported mapping family; it does
not claim a solved generic planner or faster native-MPP/XIR/SIMD paths. The
complete methods and four-metric audit
retain all candidates, controls, failures and validation boundaries.
Closed matrix epilogues: general legality, mixed profitability
The fragment-element extension admits closed, same-owner scalar DAGs after MMA. Ordinary typed arithmetic, pure calls and proven compiler-owned temporary lifetimes determine eligibility; production code does not recognize ReLU/GELU names. MPP exposes local element capacity, validity and scalar access through an optional native C++ contract. The planner counts released storage but retains scalar arithmetic work. This is a new legal candidate, not calibrated ranking or a new default.
The fixed-schedule comparison uses the same final compiler, changing only
fuse_matrix_epilogues. Every graph requests 64×64 output blocks, nominal
BK=4096, 256 workers and one pipeline stage. Four rounds balance fusion and
native/Torch order independently, with seven samples, 20 ms host windows and
100 ms warmup. The 256-worker setting is a common legal diagnostic binding,
not a universal planner recommendation. All 288 complete outputs pass
the FP64 expression oracle at atol=rtol=1e-4; the independent audit checks
882,766,800 element-validation receipts, source hashes and raw GPU divisors.
ReLU and GELU below mean max(v, 0) and tanh-GELU of
v = 0.125 * (A @ B) + 0.25. Torch preallocates the output and matrix
intermediate, using eager mm.out, in-place scale/shift and activation.out.
It is not compiled fused Torch or MPSGraph; plain MPS GEMM would not be
a matching baseline for these graphs. No independent native-MPP/CPU gain
follows from this TIRx-only extension.
Graph / M×N×K |
Reference GPU µs |
Fragment GPU µs |
Torch GPU µs |
New/old median [range] |
Faster / 4 |
New/Torch |
|---|---|---|---|---|---|---|
ReLU / 128³ |
9.601 |
8.985 |
20.449 |
0.938 [0.869–0.968] |
4 |
0.434 |
GELU / 128³ |
10.767 |
13.069 |
25.681 |
1.243 [1.150–1.270] |
0 |
0.513 |
ReLU / 127×193×61 |
22.733 |
19.061 |
19.415 |
0.845 [0.802–0.877] |
4 |
0.976 |
GELU / 127×193×61 |
24.355 |
20.939 |
21.326 |
0.856 [0.830–0.898] |
4 |
0.976 |
ReLU / 1024³ |
423.917 |
419.663 |
395.505 |
0.997 [0.986–1.054] |
2 |
1.062 |
GELU / 1024³ |
428.998 |
435.551 |
419.446 |
1.033 [1.013–1.067] |
0 |
1.036 |
ReLU / 4096³ |
35756.562 |
37842.229 |
20620.292 |
1.054 [1.028–1.088] |
0 |
1.844 |
GELU / 4096³ |
28988.562 |
39106.771 |
20622.875 |
1.351 [1.343–1.385] |
0 |
1.898 |
ReLU / 128×2048×512 |
50.449 |
48.768 |
61.934 |
0.965 [0.952–0.995] |
4 |
0.789 |
GELU / 128×2048×512 |
50.806 |
56.118 |
69.383 |
1.105 [1.065–1.126] |
0 |
0.811 |
ReLU / 2048×128×512 |
49.546 |
48.686 |
64.481 |
0.980 [0.972–0.985] |
4 |
0.751 |
GELU / 2048×128×512 |
50.083 |
56.444 |
93.836 |
1.123 [1.105–1.136] |
0 |
0.597 |
GPU times are no-counter command-buffer batch intervals, not isolated kernel durations. Ratios use within-round pairs, not the displayed medians; ranges are not confidence intervals. ReLU/GELU release 16/32 KiB of planned shared storage at this block size, but that does not imply faster execution: 4096³ GELU regresses in all four GPU and E2E pairs (35.14%/32.42% median). Ragged ReLU/GELU improve all four GPU and E2E pairs, but their approximately 2.4% GPU advantage over Torch reverses in two rounds each. Both larger squares still lose to Torch. Tiny ReLU’s GPU improvement does not translate to batched E2E (new/old 1.001); latency is also mixed.
Six plain-GEMM controls have byte-identical enabled/disabled source, yet individual GPU new/old ratios range from 0.790 to 1.049. Even the identical 4096³ control favors one arm in all four GPU rounds. Desktop variation and order sensitivity therefore remain visible; this study does not justify fitting coefficients, claiming broad speedups or enabling fusion globally. The generated scalar DAG can still be expanded by later TVM simplification; live-state, preserved reuse and scalar instruction costs need investigation, not an assumed spill or occupancy diagnosis.
The initial auto-worker screen also retains three ragged failures per
compiler, at the pre-existing automatic 1024-worker binding. The baseline
source compiles with the Metal compiler and runs with 256 workers; pipeline
admission/resource attribution remains unresolved. The fixed replay is not
evidence that auto-1024 was repaired. Default-off compatibility controls cover
ten Metal and four CPU programs with 56 passing native/Torch outputs and
unchanged executable IR. The
complete protocol, six-metric audit and failure record
retain all 144 replay rows, 30 sources, original screens and test boundaries.
CPU TIRx: reference gaps and proved provider realizations
The original six-round, eight-shape reference-loop cohort remains useful as a
negative control. At 1024³ it measured 5919.062 µs versus Torch at 1020.527 µs
and direct Accelerate at 1027.681 µs: a paired 5.769× TIRx/Torch gap. Changing
only target-cpu did not change the emitted 4×16 register-blocked loop body or
close that gap. Cache-aware panels, packing/reuse and a matrix microkernel were
absent from the reachable realization family, so a better solver score could
not help.
The new solution preserves the same TileIR semantics but adds a target realization boundary. Structural TileIR matching proves a whole compact FP32 GEMM or an exact reduction recurrence; structural export preserves every pure multi-consumer Tile SSA by default. The CPU pass then revalidates the actual TIRx body, buffer ABI, layout, alias contract and target policy before choosing a resource or provider atom. It never matches a diagnostic operation name, and an explicit unsupported request fails rather than silently changing semantics.
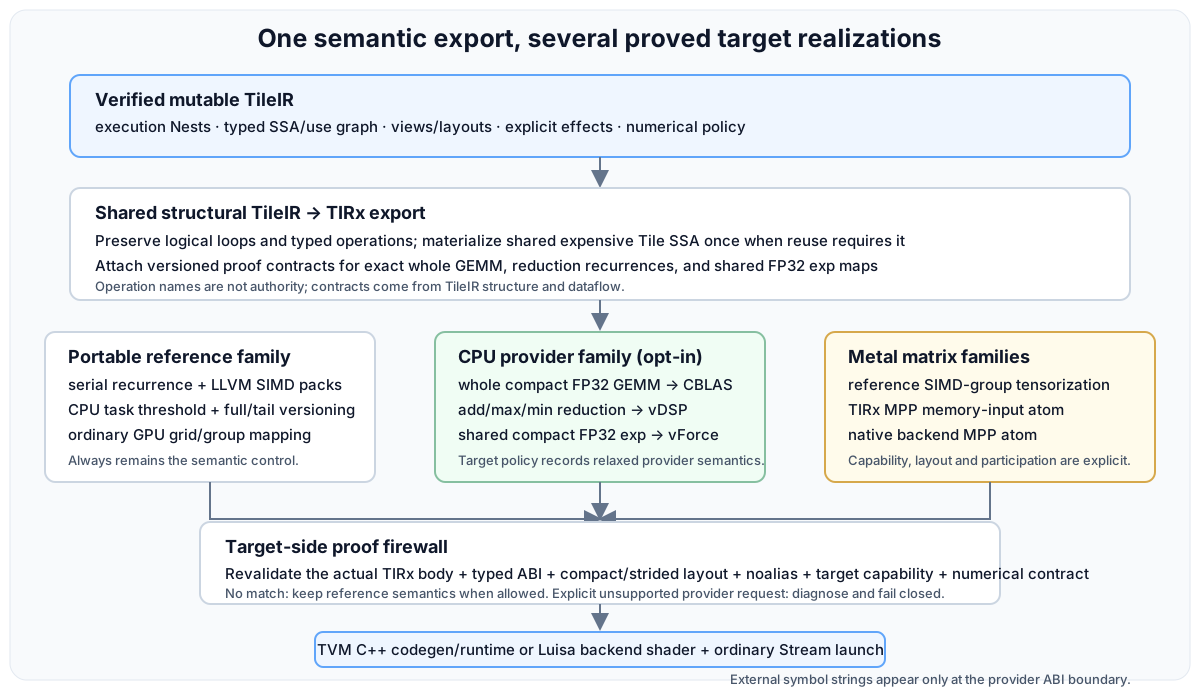
Provider calls are target realizations selected from proved semantic contracts; direct CBLAS/MPS benchmark programs remain independent baselines.
Whole-GEMM CBLAS realization
The current single-session plan
verifies that each generated LLVM kernel has exactly one external matrix call.
The six-order replay
then freezes those schedules and remeasures Tile, eager PyTorch and a separate
direct Accelerate CBLAS executable. There are 48 valid complete-output rows,
zero failures, and stable binary/library hashes.
FP32 shape M×N×K |
Tile→TIRx→CBLAS µs |
eager Torch µs |
direct CBLAS µs |
paired Tile / CBLAS [range] |
|---|---|---|---|---|
32×32×32 |
0.503 |
0.918 |
0.390 |
1.254× [1.071, 1.484] |
128×128×128 |
4.518 |
4.961 |
4.073 |
1.105× [1.085, 1.148] |
512×512×512 |
130.099 |
139.469 |
131.055 |
0.995× [0.988, 1.002] |
1024×1024×1024 |
984.515 |
930.311 |
965.743 |
1.031× [0.893, 1.234] |
256×1024×128 |
65.597 |
65.877 |
64.332 |
1.020× [1.007, 1.026] |
1024×128×256 |
62.717 |
63.152 |
61.323 |
1.023× [1.019, 1.028] |
127×193×61 |
6.287 |
6.791 |
6.030 |
1.047× [1.012, 1.075] |
513×257×129 |
43.612 |
43.701 |
43.356 |
1.005× [0.990, 1.035] |
The Tile path beats the displayed Torch median on seven of eight shapes. The comparison against direct CBLAS answers a different question: wrapper and TVM packed-ABI overhead are visible, especially at 32³ and 128³. The wide 1024³ range also shows why one lucky run must not be used as the headline.
Target-specific residual-LayerNorm materialization
The
CPU materialization search
holds native LLVM code generation, input-view forwarding, automatic element
packing, eight host threads and a 64 KiB compiler-local stack budget fixed.
Every one of its four measured winners uses EXPENSIVE_ONLY: 0.252, 8.799,
36.271 and 70.599 µs for widths 127, 257, 1024 and 4096. The corresponding
Tile/Torch ratios are 0.109×, 0.225×, 0.382× and 0.643×.
Metal selects PRESERVE on the identical semantic kernel because its mapped
worker stripes avoid repeated global reads. CPU benefits from recomputation
and LLVM fusion. This is direct evidence that preserving SSA in Candidate
TileIR does not imply a universal physical allocation; materialization belongs
beside binding, distribution and atom selection in the target plan.
Two other CPU scheduling repairs matter independently of providers. Automatic roots below 64 cheap tasks stay serial unless the source explicitly requests a worker scope; small roots containing transcendental/opaque work retain parallel execution. Ragged SIMD packs are binary-versioned into a proved all-lanes fast arm and an unchanged guarded slow arm. This removed full-pack store scalarization: the 17×257 add control is now about 0.42 µs instead of the earlier 2.84 µs observation. Both policies preserve the original tail and parallel semantics and have dedicated structural/numerical tests.